Spatial Analysis with ArcView: 2-D
Spatial Analysis with ArcView: 2-D. Calculating viewshed Calculating line of sight Add x and y coordinates Deriving slope from surface data Deriving aspect from surface data deriving flow direction calculate flow length delineating watershed. Visibility Analysis. Two types

Spatial Analysis with ArcView: 2-D
E N D
Presentation Transcript
Calculating viewshed • Calculating line of sight • Add x and y coordinates • Deriving slope from surface data • Deriving aspect from surface data • deriving flow direction • calculate flow length • delineating watershed
Visibility Analysis • Two types • (1) Viewshed analysis identifies the areas on a surface that are visible from one or more observation points. It answers the question, 'What can I see from these locations?' • (2) Line of sight tells you whether a given target is visible from a particular point of observation. It answers the question, 'Can I see that from here?'
ArcView Spatial Analyst Calculate Viewshed Surface/calculate viewshed
Viewshed Fields • SPOT • OFFSET • RADIUS
SPOT • Defines the height of the observation point. • The SPOT field is useful when all observation points are located at absolute heights.
SPOT • A SPOT field has been added to the observation theme and given values of 3000 meters for each point. (The highest elevation in the grid theme is 1,966 meters.) These values might represent visibility from an airplane at each of the five observation points.
OFFSET • The viewshed has been calculated using an OFFSET field with values of thirty meters above each observation point.
RADIUS • Limit the visible distance from each observation point.
RADIUS • Here you see a visibility grid created with RADIUS values of 1,000 meters
Line of sight analysis • Determines whether a given target is visible from a given observer's point of view.
Line of sight analysis A line of sight was drawn from the lower left to the upper right over the mountain. Green line segments indicate visible terrain along the line graphic. Red line segments indicate terrain that is not visible.
Line of sight visibility profile for the line drawn across Mt. Ranier. You can see the profile of the mountain. Green line segments represent visible terrain. Red line segments represent hidden terrain.
Deriving Slope and Aspect • Slope identifies the maximum rate of change in values between each cell and its neighbors. • Aspect identifies the down slope direction of the maximum rate of change in value from each cell to its neighbors.
Deriving Slope • The output slope grid contains values representing degree of slope (from 0-90). • Slope values can also expressed as a percentage.
e1 e2 e3 e4 C0 e5 e6 e7 e8 Horn’s algorithm for computing slope and aspect at C0 using the eight neighboring cells of C0 (((e1+2e4+e6)-(e3+2e5+e8))2+((e6+2e7+e8)-(e1+2e2+e3))2)0.5 S= ____________________________________________________________________________ 8d
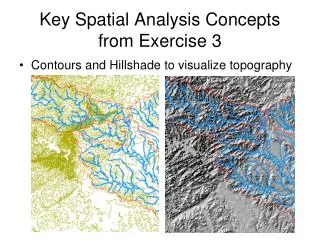
Slope theme of Mt. Ranier. Areas with darker shading have a steeper slope than those with lighter shading.
e1 e2 e3 e4 C0 e5 e6 e7 e8 Slope aspect can be computed by D=arctan(((e6+2e7+e8)-(e1+2e2+e3))/((e1+2e4+e6)-(e3+2e5+e8)))
Aspect Directions A cell with an aspect value of 90 is angled or facing east.If you walked down that hill, you would be walking east.
Make sure the same unit of x,y and z values, if not: Using Map calculator to convert DEM by multiplying or dividing a factor 3.281 .
Add x and y to attribute table using the Field Calculator • Add a theme and open the attribute table • theme/Start Editing/Edit/Add Field/x field • double click the new field and then go to Field/Calculate menu. • The field calculator will appear and will ask for a formula for the x-coordinate. Type .GetX. Then click ok. • Same way to extract y values
67 56 49 52 48 37 58 55 22 Direction of Steepest Descent 30 30 67 56 49 52 48 37 58 55 22 Slope:
4 3 2 5 1 6 7 8 Eight Direction Pour Point Model D8
Generating Surface Parameters - Flow Direction • If a cell is lower than its eight neighbors, that cell is given the value of its lowest neighbor and flow is defined towards this cell. • If a cell has the same slope in multiple directions and is not part of a sink the flow direction is calculated by summing the multiple directions
Generating Surface Parameters - Flow Accumulation • Accumulated flow is calculated as the accumulated number of all cells flowing into each downslope cell.
For an accumulation surface the value of each cell represents the total number of cells that flow into an individual cell • Cells that have high accumulation are areas of concentrated flow and may be used to identify stream channels.
Contributing Area Grid 1 1 1 1 1 1 1 1 1 1 1 4 3 3 1 4 3 1 1 3 1 1 1 1 1 12 1 2 1 12 1 1 1 2 16 1 1 2 1 16 2 1 3 6 25 3 6 1 2 25
1 1 1 1 1 1 4 3 3 1 1 2 1 1 12 1 1 1 2 16 2 1 3 6 25 Contributing Area > 10 Cell Threshold
Filling in the Pits • DEM creation results in artificial pits in the landscape • A pit is a set of one or more cells which has no downstream cells around it • Unless these pits are filled they become sinks and isolate portions of the watershed • Pit filling is first thing done with a DEM
Generating Surface Parameters - Flow Length • Another parameter that can be calculated is flow length • Flow length is defined as the length of the longest flow path within a drainage basin or watershed.
2 144.6 114.6 2 84.6 2 30 1 128 0 132.3 1 102.3 1 72.3 1 42.3 128 30 64 128 144.6 114.6 128 128 84.6 72.3 64 84.6 32 156.9 128 64 126.9 100 114.6 32 126.9 0 80 Flow Direction Surface Flow Length Surface Assuming 30 meter sq. cells
Generating Watersheds and Catchments • Now you are ready to start delineating watershed basins • Watersheds or Catchment areas are the basis for many hydrologic analysis • Watersheds can be created for any spot in a dataset.
Pour Point Contributing Area
Drainage Density for Different Support Area Thresholds 100 grid cell threshold 1000 grid cell threshold
Suggestion:One contributing area threshold does not fit all watersheds.
Wetness Index • wetness index = ln(As / tanB), where: • As = Contributing Catchment Area in meters squared • B = Slope of cell measured in degrees
AREA 2 3 AREA 1 12 Are there any questions ?