Download
1 / 47
670 likes | 1.72k Vues
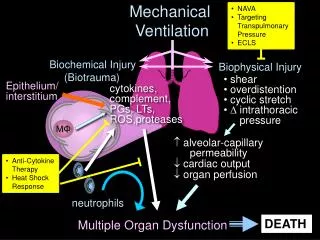
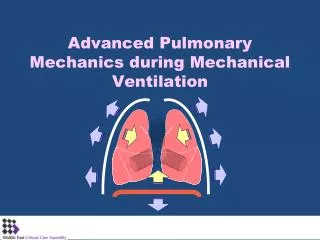
Pulmonary Mechanics and Graphics during Mechanical Ventilation. Mechanics : Expression of lung function through measures of pressure and flow: Derived parameters: volume, compliance, resistance, work. Graphics :

E N D
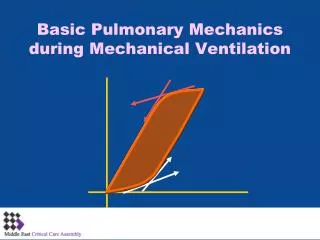
Pulmonary Mechanics and Graphics during Mechanical Ventilation
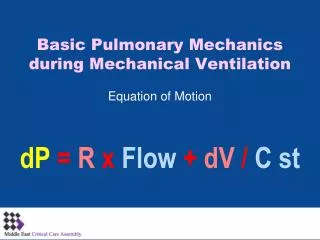
Mechanics: Expression of lung function through measures of pressure and flow: Derived parameters: volume, compliance, resistance, work Graphics: Plotting one parameter as a function of time or as a function of another parameter P - T , F - T , V – T F - V , P - V Definition
Objectives • Evaluate lung function • Assess response to therapy • Optimize mechanical support
Exponential Decay y 37 13.5 5 TC y = y0 . e (-t / TC)
Exponential Rise y 95 86.5 63 TC y = yf . (1 - e (-t / TC))
Time Constant () • Time required for rise to 63% • Time required for fall to 37% • In Pul. System= Compliance• Resistance = (0.05 to 0.1) • 10 = 0.5 – 1 sec
Airway Pressure • Equation of MotionPaw = V(t) / C + R . V(t) + PEEP + PEEPi •
Airway PressureSites of Measurement • Directly at proximal airway • At the inspiratory valve • At the expiratory valve
Airway PressureSites of Measurement • Directly at proximal airway • The best approximation • Technical difficulty • Hostile environment
Airway PressureSites of Measurement • Directly at proximal airway • At the inspiratory valve To approximate airway pressure duringexpiration
Airway PressureSites of Measurement • Directly at proximal airway • At the inspiratory valve • At the expiratory valve To approximate airway pressure duringinspiration
A typical airway pressure waveform Volume ventilation PIP PPlat Linear increase End-exp. Pause (Auto-PEEP) Initial rise
Peak Alveolar Pressure (Pplat) • Palv can not be measured directly • If flow is present, during inspiration:Paw > Pplat Measurement by end-inspiratory hold
Peak Inspiratory Pressure (PIP) PPlat PZ Pressure at Zero Flow
Peak Alveolar Pressure (Pplat)Uses • Prevention of overinflationPplat 34 cmH2O • Compliance calculationCStat = VT / (PPlat – PEEP) • Resistance calculationRI = (PIP – PPlat) / VI
Auto-PEEP • Short TE air entrapment • Auto-PEEP = The averaged pressure by trapped gas in different lung units • TE shorter than 3 expiratory time constant • So it is a potential cause of hyperinflation
Auto-PEEPEffects • Overinflation • Failure to trigger • Barotrauma
Auto-PEEP Measurement technique
Auto-PEEPInfluencing factors • Ventilator settings: RR – VT – TPlat – I:E – TE • Lung function: Resistance – Compliance • auto-PEEP = VT / (C · (eTe/ – 1))Te = Exp. Time , = Exp. Time constant , C = Compliance
Esophageal Pressure • In the lower third(35– 40cm, nares) • Fill then remove all but 0.5 – 1 ml • Baydur maneuver, cardiac oscillation • Pleural pressure changes • Work of breathing • Chest wall compliance • Auto-PEEP
Esophageal PressureAuto-PEEP Measurement • Airway flow & esophageal pressure trace • Auto-PEEP = Change in esophageal pressure to reverse flow direction • Passive exhalation
Esophageal Pressure Auto-PEEP Measurement Flow Peso
FlowInspiratory Volume ventilation • Value by Peak Flow Rate button • Waveform by Waveform select button
FlowInspiratory Pressure ventilation • Value : V = (P / R) · (e-t / ) • Waveform: ·
FlowExpiratory • Palv , RA , • V = –(Palv / R) · (e-t / ) ·
Flow waveformapplication • Detection of Auto-PEEP 1) Expiratory waveform not return to baseline (no quantification) 2) May be falsely negative Flow at end-expiration
Flow waveformapplication • Dips in exp. flow during assisted ventilation or PSV: Insufficient trigger effort Auto-PEEP Inspiratory effort
Volume • Measurement: Integration of expiratory flow waveform
Compliance • VT divided by the pressure required to produce that volume:C = V / P = VT / (Pplat – PEEP) • Range in mechanically ventilated patients:50 – 100 ml/cmH2O • 1 / CT = 1 / Ccw + 1 / CL
Chest wall compliance(Ccw) • Changes in Peso during passive inflation • Normal range: 100 – 200 ml/cmH2O 400 ml
Chest wall complianceDecrease • Abdominal distension • Chest wall edema • Chest wall burn • Thoracic deformities • Muscle tone
Chest wall complianceIncrease • Flail Chest • Muscle paralysis
Lung compliance • VTdivided by transpulmonary pressure (PTP) • PTP = Pplat – Peso • Normal range : 100 – 200 ml/cmH2O 30 cmH2O PTP = Pplat – Peso= 30 – 17 = 13 17 cmH2O
Pulmonary edema ARDS Pneumothorax Consolidation Atelectasis Pulmonary fibrosis Pneumonectomy Bronchial intubation Hyperinflation Pleural effusion Abdominal distension Chest wall deformity Lung complianceDecrease
Airway resistance • Volume ventilationRI = (PIP – PPlat) / VIRE = (Pplat – PEEP) / VEXP • Intubated mechanically ventilatedRI 10 cmH2O/L/secRE > RI · ·
Airway resistanceIncreased • Bronchospasm • Secretions • Small ID tracheal tube • Mucosal edema
Mean Airway Pressure • Beneficial and detrimental effects of IPPV • Direct relationship to oxygenation • Time average of pressures in a cycle • Pressure ventilation (PIP – PEEP) · (TI / Ttot) + PEEP • Volume ventilation 0.5 · (PIP – PEEP) · (TI / Ttot) + PEEP
Mean Airway PressureTypical values • Normal lung : 5 – 10 cmH2O • ARDS : 15 – 30 cmH2O • COPD : 10 – 20 cmH2O
Pressure-Volume Loop • Static elastic forces of the respiratory system independent of the dynamic and viscoelastic properties • Super-syringe technique • Constant flow inflation • Lung and chest wall component • Chest wall PV: Volume vs. Peso • Lung PV: Volume vs. PTP
PV Loop • Normal shape: Sigmoidal • Hysteresis: Inflation vs. deflation • In acute lung injury:Initial flat segment – LIP – Linear portion – UIP • LIP = Closing volume in normal subjects • UIP = Overdistension • Best use of PV loop: To guide ventilator management PEEP > LIP , Pplat < UIP
PV Loop in Acute Lung Injury UIP LIP
PEEP > LIP , Pplat < UIP • Reduce ventilator associated lung injury • Prevention of overinflation • Increased recruitment of collapsed units • Lower incidence of barotrauma • Higher weaning rate • Higher survival rate
PV LoopRole of chest wall component • Effect on LIP and UIP • PV loop for lung alone: Use of Peso • LIP underestimates the necessary PEEP • Better results with PEEP set above LIP on deflation PV loop rather inflation
Volume Ventilation Parameters Interaction Run VVPI Program