Download
1 / 22
220 likes | 388 Vues
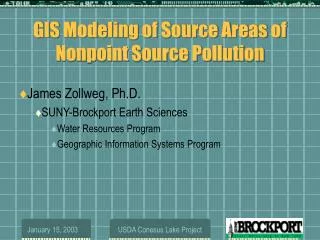
GIS Modeling of Source Areas of Agricultural Nonpoint Source Pollution. James Zollweg, Ph.D. SUNY-Brockport Earth Sciences Water Resources Program. Overview. Nature/history of modeling work Philosophy of this approach Sand Point Gully study area Goals.

E N D
GIS Modeling of Source Areas of Agricultural Nonpoint Source Pollution James Zollweg, Ph.D. SUNY-Brockport Earth Sciences Water Resources Program USDA Conesus Lake Project
Overview • Nature/history of modeling work • Philosophy of this approach • Sand Point Gully study area • Goals USDA Conesus Lake Project
Runoff and Soil Moisture Modeling with SMR • Variable Source Area Hydrology • Critical Source Areas for Nonpoint Source Pollution USDA Conesus Lake Project
Runoff and Soil Moisture Modeling with SMR • SMR – The Soil Moisture Routing Model • GIS is the Ideal Environmental Modeling Platform • Spatially-distributed, Physically-based USDA Conesus Lake Project
Runoff and Soil Moisture Modeling with SMR Private Function HM_NeighborFlow(sStorage As String, _ pInterflowRaster As IRaster, ierr As Integer) As Boolean '----------------------------------------------------------------------------- ' The storage is adjusted for the amount leaving, the interflow and the amount ' entering from neighbor cells. The maps north, northeast, east, southeast, ' south, southwest, west and northwest represent the fraction of flow heading ' in 'that' direction from the current cell. Therefore to find the amount ' entering the current cell one needs to look at the neighbor cells and the ' corresponding maps which point to the current cell. For example, if the ' current cell is (i,j) and one looks to the north (i-1,j) one would use the ' south map to get the fraction of flow since the current cell is south of its ' north neighbor. ' --------------------------------------------------------------- ' | cell: (i-1, j-1) | cell: (i-1, j) | cell: (i-1, j+1) | ' | map: southeast | map: south | map: southwest | ' --------------------------------------------------------------- ' | cell: (i-1, j) | cell: (i, j) | cell: (i+1, j+1) | ' | map: east | map: none | map: west | ' --------------------------------------------------------------- ' | cell: (i+1, j-1) | cell: (i+1, j) | cell: (i+1, j+1) | ' | map: northeast | map: north | map: northwest | ' --------------------------------------------------------------- (148 pages of code) • Coded and Running in Lennon Hall Using Visual BASIC within ArcGIS 8.2 • Complete Control of Code • Easy to Integrate Additional Environmental Modeling Concepts USDA Conesus Lake Project
Brown Watershed – Tributary of WD38, Klingerstown, PA USDA Conesus Lake Project
Relationship Between Soil Test P and Dissolved P in Runoff From: Daniel, et al. (1994) USDA Conesus Lake Project
P LOSS - 4/25/92 UTM Easting UTM Northing USDA Conesus Lake Project
Overview • Nature/history of modeling work • Philosophy of this approach • Sand Point Gully study area • Goals USDA Conesus Lake Project
Pertinent GIS features • preserves physical meaning throughout • allows internal validation • provides visualization of input data and model results • “integrates” point processes to watershed scale • flexible/modifiable/adaptable USDA Conesus Lake Project
COMPUTER MODELING FIELD STUDIES USDA Conesus Lake Project
Regulatory agencies, Extension agencies, Farm managers integrated nutrient management Phosphorous Transport Nitrogen Transport SMR Saturated Areas design hydrology Streamflow Action agencies, Consulting engineers USDA Conesus Lake Project
Overview • Nature/history of modeling work • Philosophy of this approach • Sand Point Gully study area • Goals USDA Conesus Lake Project
Field Verification of Soil Moisture Status USDA Conesus Lake Project
Suggests SOF, SOF w/erosion, and subsurface stormflow USDA Conesus Lake Project
Erosion Model (Rose, 1999) USDA Conesus Lake Project
Erosion Model Dietrich (1992) Topographic Accumulation Slope USDA Conesus Lake Project
Overview • Nature/history of modeling work • Philosophy of this approach • Sand Point Gully study area • Goals USDA Conesus Lake Project
Goals • Correctly model streamflow • Verify soil moisture distribution • 7 years worth of improvements and enhancements • Correctly model water quality characteristics • Soil erosion + sediment modules complete • Investigate use of QPF as a WQ management tool • Results in time for grant re-submission USDA Conesus Lake Project