Biodiversity
Learn about the importance of sampling in measuring biodiversity, how to measure species richness and evenness, and calculate Simpson’s Index of Diversity. Explore different sampling techniques and equipment for plants and small animals.

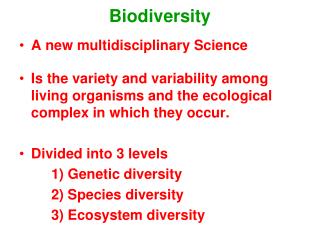
Biodiversity
E N D
Presentation Transcript
Biodiversity Sampling and Simpson’s Index
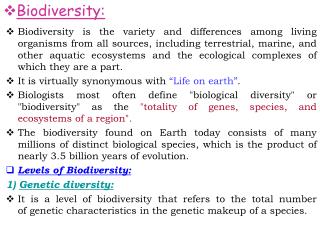
Definitions • Ecosystem • All Biotic(living) and Abiotic (non living factors) • Species • Organisms with similar appearance, anatomy, physiology, biochemistry and genetics that can interbreed freely to produce fertile offspring
Habitat • Where individuals of a species live • Specific locality, with specific conditions that species may be well adapted to
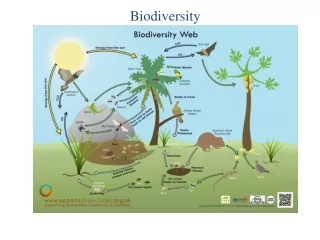
Biodiversity • This includes all the different • plants, • animals, • fungus, • microorganisms. • Their genes • and the ecosystem that they form part of. • Takes into account the number of different species and the numbers of individuals
Lesson Objectives • explain the importance of sampling in measuring the biodiversity of a habitat • describe how random samples can be taken when measuring biodiversity; • describe how to measure species richness and species evenness in a habitat;
Objectives • use Simpson’s Index of Diversity (D) to calculate the biodiversity of a habitat, using the formula D = 1-(Σ(n/N)2) (HSW3); • outline the significance of both high and low values of Simpson’s Index of Diversity (D); • discuss current estimates of global biodiversity.
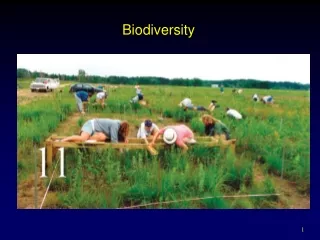
Why sample? • You can’t practically count every single organism • Sampling provides a representation of the number and distribution of an organism • There must be sufficient number of samples for the results to be representative of the situation
Equipment to survey Plants • Tape measures • Quadrats • Collection/ trapping equipment • Identification sheets/keys
Types of quadrat • Frame quadrat • Size • often 0.25m² • Sometimes 1m² or 10cm² • Point quadrat
Point quadrat • Particularly useful when sampling taller vegetation e.g. meadow
Point quadrats p195 Method • Pin dropped through holes in horizontal bar • Each species the pin touches is recorded Advantages • Good for dense vegetation (e.g. grassland) Disadvantages • No good for plants taller than the frame • Overestimates tall, thin leaved plants
Avoiding Bias in Sampling • It helps to ensure the sample is representative of the habitat. • Randomised sampling. • Systematic sampling e.g. transect
Randomised quadrat sampling Random point sampling Random quadrat sampling
Lay out a grid using tape measures. • Use random numbers to plot coordinates within the grid. • Sample at each point Limitation In a large grid of this method is that each point can be difficult to identify using 2 tape measures Solutions • Use more than 2 tape measures or laser • In a very large area. Select coordinates from a map of the area and use a GPS to find the exact position
Systematic Sampling • Take samples at regular distances across the habitat, or within a grid
Types of transect Line – single tape stretched in straight line Belt – a strip (e.g. 1m wide) These can be: • Continuous – sampling takes place over a short distance from one end to another • Interrupted – over a longer distance, taken at intervals (e.g. every 10m)
Line transects • Tape or rope sets out the line • The species occurring on the line are recorded (usually at regular intervals) • Lines can be chosen randomly (see diagram right) or may follow an environmental gradient such as a slope
Transect This transect does not take into account the changes in height.
Number of Samples • Sufficient to give a representative sample • Wider the area the more samples should be done so no common plants are missed out. • Repeat transect at several points across the area sampled • Statistical analysis of the results will indicate if the results are significant
Measuring plant and immobile organism numbers (abundance) • Counts • Density • Frequency • Percentage cover • Biomass • Abundance scales
Density of a species Method: count no. of individuals in all quadrats, then calculate mean per unit area Suitable for: larger plants that are easy to identify as single individuals (e.g. yarrow)
Frequency of occurrence Method: e.g. if grass occurs in 15 out of 30 quadrats, the frequency of occurrence is 50% Suitable for: species that are hard to count. However, it ignores density & distribution.
Percentage cover Method: estimate the area within a quadrat covered by a plant species Suitable for: areas where a species is abundant. Less useful if plants occur in overlapping layers.
Biomass Method: Collect samples including roots of plants. Weigh to record their mass. Can be wet (or occasionally dry). Suitable for: constructing a pyramid of biomass/ best for simple food chains/not involving large animals
Abundance scales Method: specific scale used – ‘ACFOR’ Abundant, Common, Frequent, Occasional, Rare Suitable for: quick, easy sampling, but very subjective, not quantitative
Sampling small animals Collection methods – land or air • Pitfall trap • Tullgren funnel • Beating tray • Pooter • Light trap • Kite (butterfly) net • Sweep net • Humane trap
Pitfall trap Tullgren funnel Pooter Kite net
Sweep Net Light trap Humane small mammal trap
Sampling animals Collection methods – in water • Plankton net • Dredge net • Drift net • ‘kick’ sampling
Survey of a pond A sample of a pond in October found these results. What problems does this data suggest? Suggest limitations with sampling that may have produced these results
Possible Sampling Limitations • some species may be small therefore not easily counted/seen as they are covered by grass or larger plants • similar species mis-identified • plants counted even if only partially within the quadrat
Limitations of sampling, impact on results and modifications Limitation • Difficult to locate exact position of random number co-ordinates in the grid Impact • leads to biased / subjective data Modification • Use additional tape measures to locate position more accurately (by forming a grid) • OR sample the area systematically
Limitations of sampling, impact on results and modifications Limitation • If biomass is only measured in one quadrat this biomass value may not be representative Impact • The quadrat may have an unusually high or low biomass Modification • Do many measurements and calculate a mean per quadrat