Download
1 / 31
310 likes | 541 Vues
SAPRiSE Project. Identifying the role of the Sun and the El Niño Southern Oscillation on Indian Summer Monsoon. Indrani Roy & Mat Collins. 25 th June, 2013. Outline. I: Observation Role of Sun and ENSO on ISM Background Analyses II : CMIP5 Model Output

E N D
SAPRiSE Project Identifying the role of the Sun and the El NiñoSouthern Oscillation on Indian Summer Monsoon Indrani Roy & Mat Collins 25th June, 2013
Outline I: Observation • Role of Sun and ENSO on ISM • Background • Analyses II : CMIP5 Model Output • Some features of ISM, ENSO in CMIP5 models • ISM and ENSO teleconnection • Hydrological Cycle in CMIP5 models and ISM
Background: General Circulation Walker Cell: Hadley Cell: India Hadley Cell: Thermally driven rising air around ITCZ and falling 30 lat. Walker Cell: EW circulation in tropics and changes direction in warm and cold phases of ENSO
Background : Indian Summer Monsoon(ISM) SLP: Climatology • Monsoon means seasonal • wind reversals. For ISM, it is • from NE ly (Jan) to SW ly • (July). • Associated with movement of • ITCZ. • Heavy rains in summer (JJAS) • due to moisture rich air from • ocean. • Walker circulation and Hadley • circulation both play role. • ISM has changed in last few • decades (IPCC, 2007) January July
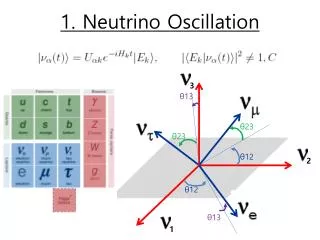
Background: Major Modes of Variability Tahiti (Australia) Different regions affected by various modes
Why NAO? Positive Phase Negative Phase • Anticorrelationbetween NAO and ISM [Sen Roy, 2011] • ISM is strongly modulated by the NAO. [Liu & Yanai, 2001] • Relationship bet. temperature W. Eurasia and ISM is stronger, over same period the rel. between the ENSO, ISM weakened. [Chang et al. [2001]
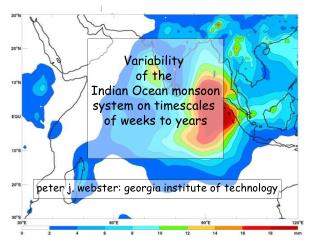
Positive Phase Negative Phase Why Indian Ocean Dipole (IOD) ? Connection: ISM- Australia- E. African rainfall IOD and ENSO have complementarily affected ISM during 1958-1997 (Ashok et al, 2001)
Atmos-Ocean coupling was different during 1950s to 1997 • Global warming caused weakening of tropical circulation: • more in the Walker cell than the Hadley cell • Strong decrease in intensity of Walker circulation after 1950s • Modest intensification since 1998 (Vecchi, et al. 2007) [McPhaden and Zhang, 2004] Could climate change during that period have modified ISM?
Solar signal on ISM detected using Solar peak year compositing JJA Max-yr JJA Min-yr Anomaly Van Loon and Meehl (2012) only used solar max-yr compositing on SLP and rainfall and suggested sun enhances ISM Is it true solar signal?
Solar Peak years and ENSO Average SSN ENSO (DJF) [Roy and Haigh, 2010] Almost all solar peak years are with –ve ENSO index ENSO signal in peak-yr compositing might be mis- interpreted as solar Is any other strong signal also mixed up in compositing method?
Solar compositing on SLP Min r.t. 1956-1997 Max r.t. 1956-1997 Max r.t. 1936-1975 Min r.t. 1936-1975 • Max-yr significant signal around Azore High, min-yrIcelandic Low. Unaffect with change of period of anomaly. • SH is mostly affected due to climate change signal during 1956-1997. • During same period, land (+ve)-sea(-ve) SLP contrast favours ISM rainfall
ISM in solar compositing covering India Min r.t. 1956-1997 Max r.t. 1956-1997 Min r.t. 1936-1975 Max r.t. 1936-1975 • Max-yr as well as min-yr compositing suggest similarly around Indian subcontinent. • Max-yrsuggest stronger effect on ITCZ that min-yr compositing.
Multiple Regression Analysis Trend SSN Volcano ENSO 14
ENSO Signal in JJA 1856-1955 1956-1997 ENSO captures SO in SLP, but major changes around Australia in later period. Australia (Darwin), one lobe of SO is also coincidentally one end of IOD. -ve NAO pattern observed in later period. Local N-S Hadley circulation, as manifest as NAO in NH and IOD in SH may have played role in modulating ISM in later period.
Solar Signal in JJA 1856-2004 Using regression, no significant signal is detected around regions of Indian subcontinent. This is true irrespective of the period considered 1956-1997 1856-1955
Some connections between Sun and ISM +ve ENSO index + -ve ENSO index * • Rainfall deficit years are usually associated with warm phase of ENSO • and vice versa (L.H.S). • Some connections, solar cycle and ISM rainfall- different since 1950s. • Decadal solar forcing on trade winds (Meehl, et al 2008, Roy & Haigh • ,2012) that acts alongside inter-annual ENSO may be responsible.
Summary I • Solar influence on ISM rainfall, using method of solar peak year compositing, may not be robust and can be influenced by factors as ENSO and trends. • Compositing suggests SH is mostly affected by climate change signal. Min year detects signal around Icelandic low and max year around Azore high. • During 2nd half of last century, the weakened Walker circulation due to climate change seems to be overtaken by local N-S Hadley circulation, as manifest as NAO in NH and IOD in SH. • Some connections between solar cycle and monsoon rainfall, which are different since 1950s.
Comparison with Observation and another model - last 50 years Observation-CRU : black; Model-all forcing: red Temporal Behaviour (Bollasina, et al 2011, Science) 5-yr running mean JJAS(relative 1940- 2005) over central-N India (box) Observation-CRU Model (NOAA GFDL CM3) all forcing Spatial Behaviour • -ve anomaly in box for both cases.
Spatial Pattern (Historical Run) Precipitation Anomaly w.r.t. (1986-2005) No consistent pattern – even in box (starting from +ve to –ve shown)
Temporal Pattern (Historial Run)-last 50 years Precipitation Anomaly w.r.t. (1940-2005) 1 1 1 2 2 2 Better results 11 year running mean Decreasing trend : inmcm4, Access1-0, MIROC-ESM, NorESM1-M Increasing : IPSL-CM5B-LR, MPI-ESM-LR, MPI-ESM-P, IPSL-CM5A-MR 1 2
Rainfall (box), 11 year running mean, blue rcp scenario. Analysis: Historical +rcp (w.r.t 1985-2005) 2 1 • Most models rising trend in rcp, some overall no trend (e.g. ), • some falling trend in rcp scenario (e.g. ). • Similar observation not only in box but also for overall rainfall. 1 2
SST(Nino 3.4 in JJAS): rcp(w.r.t 1985-2005) 3 1 2 • Model with least trend in Nino • Model high variable Nino • All models rising trend in rcp, exception 1 2 3
ISM and ENSO Teleconnection • -ve correlation - both in historical (I) and rcp (II)- after removing trend. • True in the box region as well.
Global Hydrological Cycle : CMIP3 (Vecchi and Soden, 2007) Moistening vary model to model, but all models exhibit a nearly linear relationship between column water vapour and surface temperature. The rate of this increase is 7.5% /K, following ClausiusClapron (C-C) equation.
Precipitation Time Series:CMIP5 Global Monsoon Global: annual & JJAS resemble. Uncertainty increases with time. Matches CMIP3 study. Nearterm prediction skill good. Monsoon: large uncertainty throughout. Magnitude-wise much higher.
Hydrological cycle and ISM:CMIP5 Annual Precipitation, vert. vel and temp Atm water and temp JJAS Precipitation, vert. vel and temp (India) Ppt, vert. vel and temp (Globe) Although there can be significant regional changes in relative humidity among models, the global-mean behaviour closely resembles that expected from (C–C) arguments also in CMIP5.
Questions to answer/future work It is usually said that monsoon increases due to increase in water vapour offset by weakening circulation. Hypothesis: Can this explain variations between CMIP5 models? Does global change reflect regional change? Studies using HADCM3/ RM3 with perturbed physics will be carried to understand monsoon dynamics. Emphasis will be on circulation fields.
Summary II ISM - General Features vary model to model in CMIP5. Model FGOALS-g2 does not show any trend in nino3.4 for historical or rcp scenario. ISM and ENSO teleconnection studied. All models suggest -ve correlation in historical as well as rcp scenario. Hydrological Cycle and ISM were analysed using CMIP5 models. Hydrological cycle matches to that of earlier CMIP3 study. Monsoon rainfall suggests large uncertainty in CMIP5.