Download
1 / 56
560 likes | 718 Vues
HURRICANE SANDY RESPONSE AND AFTERMATH - The New Reality of Natural Hazard Risk. Savita Goel, WDP & Associates Heather Roiter Damiano , NYC Office of Emergency Management David F Smith, EQECAT Damian Wach, Prudential Mortgage Capital Company. April 29, 2014. LEARNING OBJECTIVES.

E N D
HURRICANE SANDY RESPONSE AND AFTERMATH - The New Reality of Natural Hazard Risk Savita Goel, WDP & Associates Heather Roiter Damiano, NYC Office of Emergency Management David F Smith, EQECAT Damian Wach, Prudential Mortgage Capital Company April 29, 2014
LEARNING OBJECTIVES • Assess how natural hazards and their threat to your organization have changed. • Lessons learned from the vantage point of key players in post-event response • Incorporate your peers’ life-lesson adjustments into your own natural disaster response program April 29, 2014
OUTLINE • Introduction to Speakers • Hurricane Sandy and CAT Modelling • Overview of NYC Infrastructure • Key Characteristics and Vulnerabilities • Aftermath of Hurricane Sandy • Challenges with Planning Post-Sandy • Risk Manager’s outlook • Discussion on Lessons Learned • Q&A April 29, 2014
INTRODUCTIONS • Introduction to Speakers • Savita Goel, WDP • David Smith, EQECAT • Heather Roiter, NYC OEM • Damian Wach, Prudential
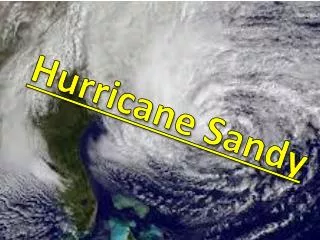
Superstorm Sandy - Highlights • Cat 1 (80 mph 1-minute) at Atlantic City, NJ landfall • Very broad windfield • ~1000 mile diameter of tropical storm force winds • Rmax significantly larger than 1938 storm • ~$ 20 trillion in insurable assets in affected states • Very low pressure (948 mb recorded at Atlantic City) • Surge heights: • ~14 feet in lower Manhattan: extreme • ~9 feet at Atlantic City: not as exceptional but still very damaging in portions of the NJ coast • Rainfall amounts and rates ~ lower than Irene • Much less inland flooding
Superstorm Sandy Superstorm Sandy Track Historic Tracks 1903 was only event that directly struck NJ coast (Cat 1, transitioning)
Modeled landfall frequencies (long term): • Virginia – Maine ~ 1 / 8 years • New York ~ 1 / 20 years • New Jersey ~ 1 / 180 years
1938 Long Island Express Boston New York Sandy-2012 Philadelphia Atlantic City Baltimore Washington Irene-2011
Reported • Atlantic City, NJ - 77 mph • Cape May, NJ - 73 mph • Clifton, NJ - 80 mph • Coney Island, NY - 69 • Dennisville (Near Cape May) - 81 mph • Greenwich, CT - 70 mph • Islip Airport , NY- 90 mph • JFK Airport , NY– 79 mph • Montclair, NJ - 88 mph • New Haven, CT - 85 mph • Newark Airport, NJ - 78 mph • Ocean City, NJ - 60 mph • Sandy Hook, NJ - 87 mph (it is a buoy) • Sandy Hook, NJ (onshore) - 81 mph • Surf City (Ocean County), NJ - 89 mph • Tompkinsville, NY – 90 mph • White Plains Airport, NY – 72 mph Boston New York 85 70 80 72 90 78 90 72 Philadelphia 87 89 Baltimore 77 60 Washington 73
Surge - Enhancing Factors • Higher Winds • Lower Pressure • Faster Translation Speed • Perpendicular Landfall • Wider Storm - More Area Affected • Shallow Offshore Slope • Confining Coastline Geometry • Peak Surge occurring at High Tide • Higher Astronomical Tide (Full/New Moon) Factors enhancing Sandy’s Surge at Landfall
Surge – Coastline Geometry NY Bight: The “corner” where NJ and NY meet at approximately 90º. Water can be funneled into the corner and pile up with nowhere to go but up. Sandy’s track allowed for a long duration of winds directing water into Raritan Bay and NY Harbor. L
Battery Park NYC – Storm Tide Resulting Storm Tide Storm Surge Normal Tide
Superstorm Sandy – Loss Estimates Losses By State • The estimated economic loss for this event is about $30 to $50 Billion • Based on the event footprint and EQECAT IED, the post-landfall (Nov. 1, 2012) insured loss estimate for Sandy is approximately$10 to $20 Billion (Later revised to $15-$20 Billion) • Latest PCS: $18.75 Billion • ~1-in-10 for U.S. • ~1-in-70 for Northeast (VA-ME) Losses By Line of Business
Residential flood insurance take up rates in New York in 2010 with Sandy storm surge estimates Source: Resources for the Future, with data from FEMA
Residential flood insurance take up rates in New Jersey in 2010 with Sandy storm surge estimates Source: Resources for the Future, with data from FEMA
Flood Damage • The National Flood Insurance Program (NFIP) reports that for a 1-story building, the average cost to replace by flooding height is: • 1 foot - 22% • 2 feet - 32% • 6 feet - 58% • 8 feet - 68% • NFIP reports that 25 to 30 percent of all paid losses were for damage in areas not officially designated at the time of loss as special flood hazard areas. (NFIP coverage is available outside high-risk zones at a lower premium.)
Hurricane / Named StormDeductibles (1) • Special hurricane deductibles had been introduced in 10 of the states affected by this event (DE, MA, MD, ME, NC, NY, RI, SC, VA), increasing the portion of hurricane damage that is the responsibility of policy holders. • Hurricane deductibles are separate thresholds that damage must exceed before insurers will indemnify losses. Hurricane deductibles of from 1% to 5% of the structure replacement value are not uncommon. Some hurricane deductibles have Cat 2 or 3 thresholds. • Insurance Commissioners and Governors were quick to instruct companies not to apply these deductibles.
Hurricane / Named StormDeductibles (2) • Sandy was downgraded to a post-tropical storm system just before it made landfall in New Jersey. • Sandy was not treated as a Hurricane for Insurance Purposes. The Regulators did not overrule the Hurricane Deductible elements in the contracts but rather chose to enforce the Meteorological Assessment that Sandy had ceased to be a Hurricane before landfall.
Wind vs. Flood - Policy Structures • Quantifying the risk for policies with distinct insurance conditions for different sub-perils (e.g. wind limit and flood sub-limit) requires: • financial modeling that explicitly addresses such conditions • exposure data representation that explicitly addresses such conditions
NYC INFRASTRUCTURE OVERVIEW • Key Features of Infrastructure • Coastal development • Development in 100-yr flood plain • Utilities infrastructure is underground – Power, Water, Wastewater • Transportation - Underground subways and the supporting infrastructure
INFRASTRUCTURE OVERVIEW – Coastal Development • Lower Manhattan in 1940’s • Lower Manhattan Now • In 1940 • Population – 7.5 million • Buildings – Lot less than a million • In 2013 (within 100-year Flood Plain) • Population – ~5% of 8.2 million • Buildings – ~7% of a million
INFRASTRUCTURE • Utilities – An Underground City • Power lines: 70% of 130,000 miles of transmission & distribution underground • Steam: 105 miles underground pipelines • Gas: 65% of heating and fuels 98% of electricity production • Water: 7000 miles of buried water mains and pipes
INFRASTRUCTURE • Transformers vaults with access from sidewalk • Grating Covers
INFRASTRUCTURE • Transportation • Roadway: 6000 miles • Inter-borough connection: Bridges & Tunnels
INFRASTRUCTURE • Transportation • Subways: Approx 5.3 million daily rides and approx. 850,000 daily commuter rides into and within NYC
BUILDINGS INFRASTRUCTURE • Key Features • Buildings with basement (sometimes multiple levels below grade) • PoE of utilities located below grade • Server rooms/ control room located in basement • Sidewalk vault with grating for ventilation • Emergency power: • Fuel tanks located in basement • Emergency Generators higher up
CONSTRUCTION TYPES • Brownstone • High-rise
KEY ATTRIBUTES • Older Buildings • Smaller windows • Heavy Exterior Walls - Masonry or stone veneer • More redundancies in design • Ballast roof • Rooftop equipment unanchored • Water tank
KEY VULNERABILITIES • Older Buildings • Ballast roof • Rooftop equipment
KEY VULNERABILITIES • Older Buildings • Rooftop equipment unanchored • Water tank
KEY ATTRIBUTES/ VULNERABILITIES • Newer Buildings • Structural System – less redundancies • Large Size Windows • Vulnerable Façade System
DAMAGE FROM HURRICANE SANDY • Flooding
DAMAGE FROM HURRICANE SANDY • Lower Manhattan in Dark in Aftermath of Hurricane Sandy
DAMAGE FROM HURRICANE SANDY • Subway Tunnel Flooded
DAMAGE FROM HURRICANE SANDY • Buildings – High Rise • Flooding • Minimal to no structural damage • Disruption led cash flow losses
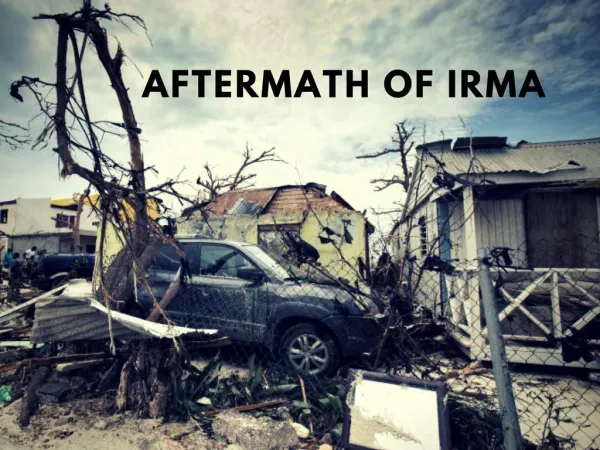
DAMAGE FROM HURRICANE SANDY • Buildings – Single Family Homes • Flooding • Structural damage and/or fallen tree
Upcoming Code Upgrades Following Lessons Learned • Flood Maps • New FIRMs • Buildings in 100-yr flood zone are mandated to have flood protection plan in place • Building Codes • Upgraded NYC Building Code in Oct. 2014
Challenges with Planning Post-Sandy Heather Roiter DamianoDirector of Hazard MitigationNYC Office of Emergency Management
NYC Coastal Storm Plan“Largest and most operational CSP in the country.”
Different Parts of the City Faced Different Types of Flood Hazard DOB Tagging by Flood Type and Geography • Surge and Wave ActionAtlantic Coast shorelines faced inundation plus impact wave action • Structures are primarily low-rise residential • Severe structural damage concentrated in areas directly facing shoreline • Stillwater FloodingUpper Harbor and other areas to the north generally experienced inundation only • Damage primarily to mechanical, electrical, and telecommunication systems and building contents Stillwater Flooding Surge and Wave Action Upper Harbor Atlantic Coast
PlaNYC: A Stronger, More Resilient New York • Mayor Bloomberg released 6/11 • Offers a roadmap to protect the city against climate hazards and sea level rise • Sets City’s priorities and strategies for long-term resiliency • Community Recovery • Lower Manhattan ; Brooklyn/Queens Waterfront; Southern Brooklyn; South Queens; Mid/South Staten Island • Infrastructure and Built Environment • 250 specific recommendations nyc.gov/resiliency • Coastal protection • Buildings • Insurance • Utilities • Liquid Fuels • Community Preparedness • Healthcare Facilities • Telecom • Transportation • Parks • Wastewater and water
OEM’s Hurricane Evacuation Map • Based on the SLOSH* model • A worst-case scenario model that is used for evacuation purposes • A combination of hurricane modeling and evacuation route analysis to produce Zones 1 through 6. • Recently updated (August 2013) to provide more flexibility in evacuation options and reduce confusion with FEMA FIRMs *SLOSH stands for Sea, Lake, and Overland Surges from Hurricanes
FEMA’s Flood Insurance Rate Maps (FIRMs) FEMA’s flood maps are developed as part of the National Flood Insurance Program. • Key functions: • Basis for understanding current flood risk (coastal and riverine) • Inform building code standards • Determine flood insurance requirements • NYC’s first FIRMs were issued in 1983 • FEMA currently updating NYC’s maps
Flood Insurance Rate MapsFEMA’s FIRMs designate flood zones based on different types of hazards. The Base Flood Elevation (BFE) is the height to which the flood waters are expected to rise.
National Flood Insurance Program ReformThe NFIP has undergone significant regulatory change over the last 18 months. • July 2012: Biggert-Waters Flood Insurance Reform Act • Prohibit premium subsidies on new or lapsed policies • Phase out subsidies for all policies • Require banks to enforce purchase requirements more vigorously • Analyze affordability impacts by April 2013 • March 2014: Homeowner Flood Insurance Affordability Act • Repeals trigger for new or lapsed policies • Caps rate increases at 18% annually (some exceptions) • Enables newly mapped properties to purchase preferred risk rate for 1 year • Authorizes additional funds for affordability study • Provides refunds for certain policies affected by BW-12 • NFIP Challenges • Pre-Sandy, NFIP was $18B in debt to Treasury ($16B from Katrina) • Expected Sandy payouts are $12-15B • Subsidized rates do not adequately reflect actual flood risk
Flood Insurance Rate MapsSandy demonstrated that New York was more vulnerable than previously thought. FEMA 1983 FIRMs vs. Sandy Inundation Area • Damage outside 1983 100-year floodplain: • > 1/3 of red- and yellow-tagged buildings • ~ 1/2 of impacted residential units • > 1/2 of impacted buildings Source: FEMA (MOTF 11/6 Hindcast surge extent) FEMA 1983 FIRMs 100-year Floodplain Sandy Inundation Area (outside the 100-year Floodplain)
Flood Insurance Rate MapsThe most recent maps, called Preliminary FIRMs, were released in December 2013 and show a floodplain that is 51% larger than previously. FEMA 1983 FIRMs vs. Preliminary FIRMs * Numbers are rounded for clarity Source: FEMA FEMA 1983 FIRMs 100-year Floodplain FEMA 2013 Preliminary FIRMs 100-year Floodplain
Flood Insurance Rate MapsGiven the City’s projections on sea level rise, these floodplains will extend even further by the 2020s and into the 2050s. Projected floodplain for the 2020s and 2050s * Numbers are rounded for clarity Source: FEMA; CUNY Institute for Sustainable Cities Source: FEMA FEMA 2013 Preliminary FIRMs 100-year Floodplain Projected 2020s 100-year Floodplain Projected 2050s 100-year Floodplain
Affordability ChallengesThe analysis shows that pre- and post-FIRM annual premium increases will be significant due to the implementation of BW-12 and the FIRM update… • Annual Premiums • Scenario • Current • New Attached 1-2 Family Red Hook, Brooklyn • Uninsured Pre-FIRM in 100-year floodplain • Lowest floor relative to BFE: -5 • Has a basement NA $4,100 Detached 1-2 Family Gerritsen Beach, Brooklyn • Newly mapped Pre-FIRM in 100-year floodplain • Lowest floor relative to BFE (new): -9 • Has a basement $429 $8,045 Detached 1-2 Family Midland Beach, Staten Island • Existing Post-FIRM in 100-year floodplain • Increase in BFE: 4 • Lowest floor relative to BFE (new): -1 $506 $2,365 • Existing Pre-FIRM multistory • Lowest floor relative to BFE (new): -9 • Has a basement Multistory unknown