Surface Observations
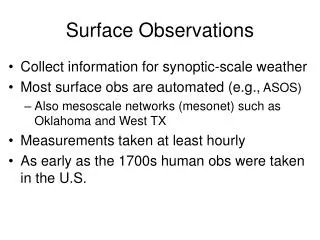
Surface Observations. Collect information for synoptic-scale weather Most surface obs are automated (e.g., ASOS) Also mesoscale networks (mesonet) such as Oklahoma and West TX Measurements taken at least hourly As early as the 1700s human obs were taken in the U.S.

Surface Observations
E N D
Presentation Transcript
Surface Observations • Collect information for synoptic-scale weather • Most surface obs are automated (e.g., ASOS) • Also mesoscale networks (mesonet) such as Oklahoma and West TX • Measurements taken at least hourly • As early as the 1700s human obs were taken in the U.S.
What’s Measured at the SFC? • Temperature (°F) • Dewpoint temperature (°F) • Pressure (corrected and reported as MSLP in mb) • Wind speed and direction (knots or mph) • Cloud cover at multiple levels • Precipitation (amount and time of start/stop) • Other current weather (distant thunder, towering cumulus, etc.)
Surface Station Plots • Information plotted on a map in compact format • Temperature, dewpoint, pressure, cloud cover, wind speed and direction, visibility, current weather and pressure tendency
Decoding the Station Plot • Temperature and dewpoint are in °F • Wind speed is usually in knots (OK Mesonet uses m.p.h.) • Pressure is reported in tenths of mb • If first number >6, put a 9 in front of number reported • If first number <4, put a 10 in front of number reported
Cloud Cover No or very few clouds 1/8 coverage 2/8 coverage 3/8 coverage 4/8 coverage 5/8 coverage 6/8 coverage 7/8 coverage Overcast Sky obscured
How to Read Wind Speed and Dir. • Meteorologists always describe where the wind is coming from!! • Describe wind speed in knots • Direction by cardinal direction (N,S,E,W) or using degrees of a circle • Both sfc and upper level maps
Another way to display data Meteogram • Another way to display surface data over a period of time • One station • Over a whole day
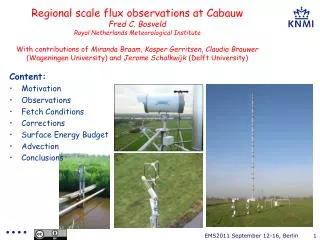
Weather Buoy • Weather Buoys • Collect surface data over the oceans • Important for estimating surface moisture return • Tropical storm winds from buoys
Upper Air Observations • Rawinsondes or radiosondes collect data • Used since the 1950’s, sent by balloon • Can plot vertical profile from one balloon • Called a sounding • Can plot horizontal view of upper atmosphere with many radiosondes, using pressure as the vertical coordinate
Data Collected by Weather Balloons • Temperature (°C) • Mixing ratio (g/kg) • Wind speed and direction (kts) • Pressure (mb or hPa) • Height above ground (meters)
Upper Air Maps • In meteorology, pressure is vertical coord. • Pressure always decreases with height • Constant pressure maps • Not truly horizontal (quasi-horizontal) • Temperature variations lead to differing heights of constant pressure surfaces • Height of troposphere changes depending on latitude; higher in tropics, lower at poles
Contours • In order to help visualize data, meteorologists draw lines or contours to help “see” the data • Typically contour: • Temperature (isotherms) • Pressure (isobars) • Height of a constant pressure surface (isoheights) • Dewpoint (isodrosotherms) • Wind speed (isotachs)
National Lightning Detection Network • Senses cloud-to-ground lightning across U.S. • Developed in late 1980s as a 2-D NLDN • NSSL recently developed a 3-D Lightning Mapping Array (LMA) for cloud-ground and cloud-cloud lightning