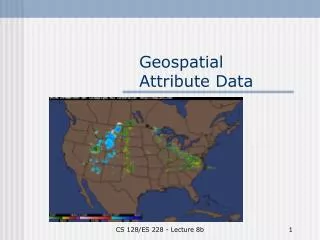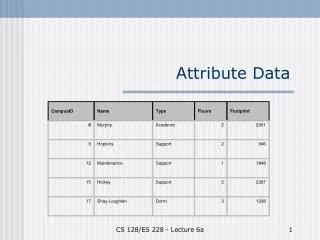
Geospatial Attribute Data
Geospatial Attribute Data. We Lied!. Earlier this semester we claimed that data was either spatial, i.e. said where something was, or attribute, i.e. told you something about an object. In fact, on the exam, we accepted “non-spatial data” as part of the definition of attributed data.

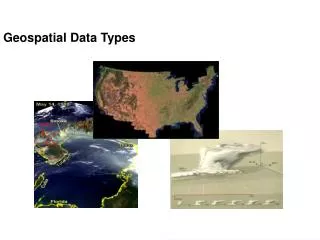
Geospatial Attribute Data
E N D
Presentation Transcript
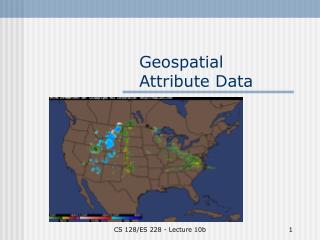
Geospatial Attribute Data CS 128/ES 228 - Lecture 10b
We Lied! • Earlier this semester we claimed that data was either spatial, i.e. said where something was, or attribute, i.e. told you something about an object. • In fact, on the exam, we accepted “non-spatial data” as part of the definition of attributed data. • BUT, it’s not that simple… CS 128/ES 228 - Lecture 10b
Some attribute data is tied to a location, not an object Estimate of phytoplankton distribution in the surface ocean: global composite image of surface chlorophyll a concentration (mg m-3) estimated from SeaWiFS data (Source: NASA Goddard Space Flight Center, Maryland, USA and ORBIMAGE, Virginia, USA). Estimate of phytoplankton distribution in the surface ocean: global composite image of surface chlorophyll a concentration (mg m-3) estimated from SeaWiFS data (Source: NASA Goddard Space Flight Center, Maryland, USA and ORBIMAGE, Virginia, USA). CS 128/ES 228 - Lecture 10b
Spatial Data – A Few Definitions • Spatial data: Data that have some form of spatial or geographical reference that enables them to be located in two or three-dimensional space. -- Heywood, Cornelius & Carver, p. 289 • Spatial data: Data that relate to the geometry of spatial features. -- Chang, Introduction to Geographical Information Systems, p. 4 • Spatial data: Any information about the location and shape of, and relationships among, geographic features. This includes remotely sensed data as well as map data. -- The GIS Dictionary, http://www.geo.ed.ac.uk/agidict/welcome.html, searched 3/27/2007 CS 128/ES 228 - Lecture 10b
A Compromise Geospatial Attribute Data Data about a non-spatial entity that is intrinsically tied to a given location CS 128/ES 228 - Lecture 10b
Examples of Geospatial Attribute Data • Rainfall • Snow depth • Land use • Crime rates • Average income level • Population statistics CS 128/ES 228 - Lecture 10b
What is special about this data? • Data sets are generally very large • Turning such data into information (or knowledge) can be tricky (or worse!) • Dimensionality becomes an issue CS 128/ES 228 - Lecture 10b
Dimensionality • Paper maps are generally two-dimensional • While color can be used as a third dimension, it is more often used for attribute display CS 128/ES 228 - Lecture 10b
Sometimes 2-D works Source: U.S. Census Bureau, 2005 American Community Survey (American FactFinder) CS 128/ES 228 - Lecture 10b
More fine-grained 2-D Image from: http://www.csc.noaa.gov/products/nchaz/htm/lidtut.htm CS 128/ES 228 - Lecture 10b
Source What’s the Weather Like in Merry Old England? CS 128/ES 228 - Lecture 10b
When 2-D tends to work • “Planar” area being mapped • One piece of data for each position • Minimal problem locating data in “space” • No “time” dimension CS 128/ES 228 - Lecture 10b
What about Time? • Traditionally described as a “fourth” dimension, time adds a “third” dimension to GIS data. • This creates problems converting the data to information and knowledge. • 2-D maps usually don’t cut it. CS 128/ES 228 - Lecture 10b
Solutions to the “Time Dilemma”:1. Graphs Source: National Weather Service http://newweb.erh.noaa.gov/ahps2/hydrograph.php?wfo=buf&gage=olnn6&view=1,1,1,1,1,1 CS 128/ES 228 - Lecture 10b
More graphing Tropical Ocean Array • Buoys in Pacific Ocean • Monitor Conditions • Monitor El Niňo http://www.pmel.noaa.gov/tao/disdel/disdel.html CS 128/ES 228 - Lecture 10b
Custom Graphs from TOA • Monthly Wind Speed data for the buoy I selected • 1977-2007 CS 128/ES 228 - Lecture 10b
Also available as… • Downloadable data file • Formatting can be an issue • But if you add it you your GIS, it’s yours! Location: 8S 165E 16 Aug 1991 to 16 Mar 2007 ( 188 times, 2 blocks) Gen. Date Mar 28 2007 Units: Winds (M/S), W. Dir (DEG), -99.9 = missing, (1,1) is NE at sqrt(2) m/s Time: 1200 16 Aug 1991 to 1200 16 Aug 1996 (index 1 to 61, 61 times) Depth (M): -4 -4 -4 -4 QUALITY YYYYMMDD HHMM UWND VWND WSPD WDIR SD 19910816 1200 -5.0 0.7 5.6 278.1 22 19910916 1200 -2.9 -1.4 4.8 243.7 22 19911016 1200 -2.7 -0.1 3.4 268.2 22 19911116 1200 -0.2 2.1 4.3 354.3 22 19911216 1200 -0.5 1.7 3.3 344.0 22 19920116 1200 1.8 1.3 4.2 53.8 22 19920215 1200 4.4 0.3 5.3 86.2 22 19920316 1200 4.0 1.0 5.3 75.7 22 CS 128/ES 228 - Lecture 10b
Solutions to the “Time Dilemma”:2. Multiple Images • Really just a set of 2-D images shown side-by-side or in sequence Source:http://commons.wikimedia.org/wiki/Image:ElectoralCollegeYYYY-Large.png CS 128/ES 228 - Lecture 10b
Items of note • Each of the images here is a separate map, no longer associated with a GIS • Each map actually contains summary information as well as traditional map elements CS 128/ES 228 - Lecture 10b
Solutions to the “Time Dilemma”:3. Animation Animation: motion pictures created by recording a series of still images—drawings, objects, or people in various positions of incremental movement—that when played back no longer appear individually as static images but combine to produce the illusion of unbroken motion. http://encarta.msn.com/encyclopedia_761567360_1/Animation.html CS 128/ES 228 - Lecture 10b
Animation My Daily Habit – Doppler Data CS 128/ES 228 - Lecture 10b
More Weather From England http://www.xcweather.co.uk/ CS 128/ES 228 - Lecture 10b
Watch My Friends Ride Across The Country http://stats.raceacrossamerica.org/2006/animation/ A similar site, with elevation profiles, exists for the Tour de France, but it only animates during the race CS 128/ES 228 - Lecture 10b
Get Seasick? http://www.pmel.noaa.gov/tao/jsdisplay/ CS 128/ES 228 - Lecture 10b
What if there is a real third dimension? • Actual images (video) • But these can only show “transparent” or “discrete” attribute data • Flyovers/fly-throughs help • Virtual reality • But most users don’t have the equipment to “view” this CS 128/ES 228 - Lecture 10b
And in the movies… (Screen snapshot of) Animation of tornado-monitoring “buoys” from the Warner Brothers film Twister Source: http://www.vfxhq.com/1996/twister.html CS 128/ES 228 - Lecture 10b
Conclusions about geospatial data • It’s abundant • It’s important • Display is a challenge • Technologies only get better CS 128/ES 228 - Lecture 10b
Great Data Sets Abound • Census bureau • USGS • Weather Service • Scientific labs • (esp. government funded) CS 128/ES 228 - Lecture 10b