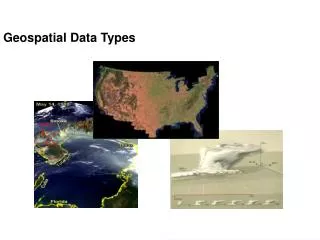
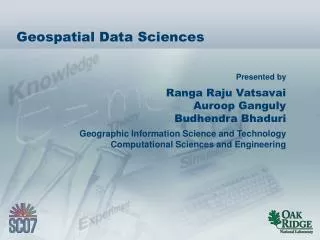
Geospatial Data Sciences
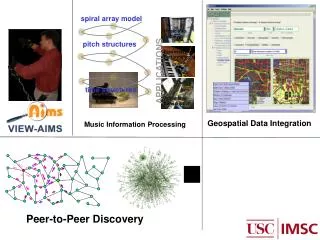
Geospatial Data Sciences. Ranga Raju Vatsavai Auroop Ganguly Budhendra Bhaduri Geographic Information Science and Technology Computational Sciences and Engineering. Geospatial data sciences. Disaster mapping and monitoring. Geospatial intelligence discovery. HP Visualization. Knowledge

Geospatial Data Sciences
E N D
Presentation Transcript
Geospatial Data Sciences Ranga Raju Vatsavai Auroop Ganguly Budhendra Bhaduri Geographic Information Science and Technology Computational Sciences and Engineering
Geospatial data sciences Disaster mapping and monitoring Geospatial intelligence discovery HP Visualization Knowledge Discovery Actionable insights/ knowledge Extremes Social networks Efficient storage and retrieval methods Terabytes of spatially referenced data per day National security HPC Errors and uncertainty GeoDatabases Petabytes of spatiotemporal data archives
? Pattern detection and decision support Consequences Additional data hypothesis generation Action End-user Analyst Process modeling Event summary Decision Offline Predictive analysis Body of actionable knowledge HIT Decision support Pattern detection Online Decision making Data integration Stream of new data
Spatial classification and prediction • Spatial autoregressive regression (SAR) • Markov random fields (MRF) SAR W matrix IKNOS 1 m TM 30 m 60,000 3,600,000,000 60 km 2000 60 km 2000 60,000 3,600,000,000 Overlap • Challenge • Large neighborhood matrices • Overlapping computation Node 1 Node 2
Extremes • A new measure to describe the relationship among extremes in space and time: • Simultaneous occurrence of 100-year return levels: • Perfect dependence 100 year event. • No dependence 10000 year event. Correlation TailDependence Correlation Tail Dependence Rainfall observations in South America Simulations from CCSM3 Climate Model • Challenge Spatiotemporal dependence estimation is computationally expensive (1000 grid cells results in scanning more than half a million pairs).
Managing uncertainty in spatiotemporal environments (MUSE) • Reasoning • Data mining • Spatial analysis • Visualization Knowledge Discovery • Challenge • Expensive query processing and spatial analysis Propagation Modeling • Conceptual • Logical GeoDB Representation Distributed asynchronous update framework Updates • Ontology • Semantic • Reasoning Data collection source of uncertainty Source
Contacts • Ranga Raju Vatsavai • Geographic Information Science and Technology • Computational Sciences and Engineering • (865) 576-3569 • vatsavairr@ornl.gov • Auroop Ganguly • Geographic Information Science and Technology • Computational Sciences and Engineering • (865) 241-1305 • gangulyar@ornl.gov • Budhendra Bhaduri • Geographic Information Science and Technology • Computational Sciences and Engineering • (865) 241-9272 • bhaduribl@ornl.gov 7 Bhaduri_GDS_SC07