Download
1 / 13
130 likes | 149 Vues
Explore the current temperature and precipitation conditions in Arizona, including live and dead fuel moisture levels, energy release components, fire potential outlook, and agency fire response statistics. Get insights into drought conditions and fire activity predictions.

E N D
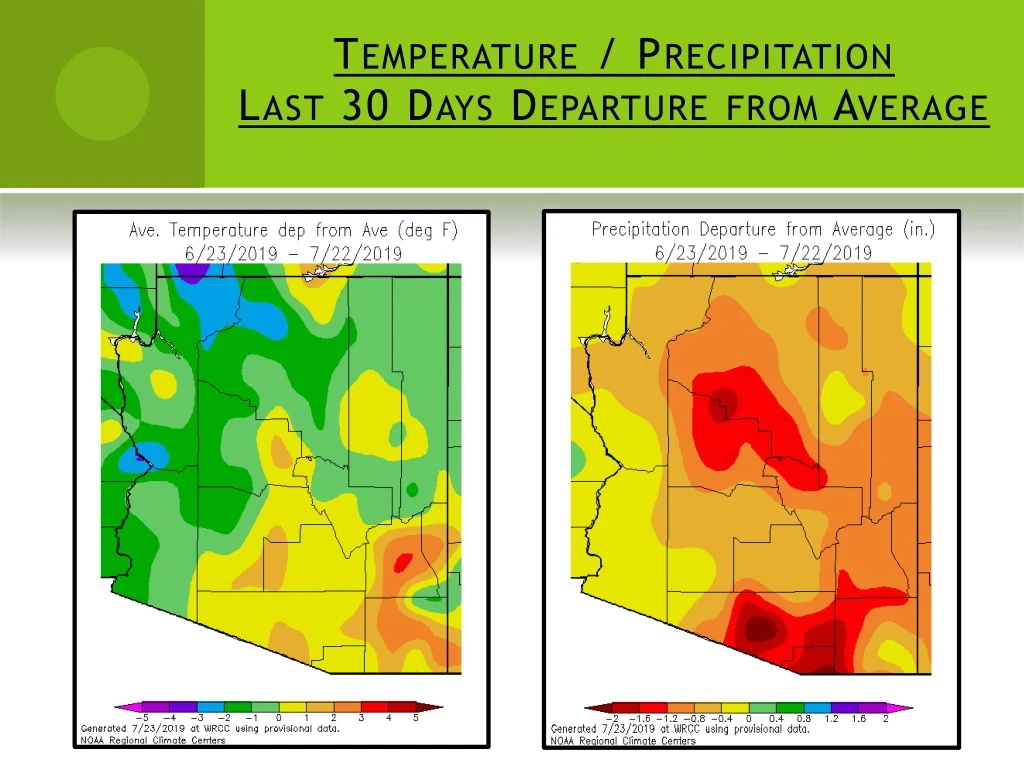
Temperature / PrecipitationLast 30 Days Departure from Average
Temperature/Precipitation One-Month Outlook • Above Normal temperature for Arizona. Normal precipitation for Arizona.
Drought Monitor • No drought conditions exist in Central Arizona • Current outlook shows no drought development likely
Dead Fuel Moisture • Dead Fuel Moisture is the moisture content of dead organic fuels that is controlled entirely by exposure to environmental conditions. There are four fuel classes modeled within NFDRS. • 1-Hour Fuel Moisture - Dead fuels less than ¼” in diameter. Very responsive to current conditions (temperature, humidity, precipitation). Value range: 1 - 80% • 10-Hour Fuel Moisture - Dead fuels ranging from ¼” to 1” in diameter. Responsive to daily changes in weather. Value range: 1 - 60% • 100-Hour Fuel Moisture - Dead fuels ranging from 1” to 3” in diameter. As opposed to 1 & 10-Hour, these fuels are impacted by 24-hour trends (Max/Min Temp, Max/Min RH, precipitation duration). Value range: 1 - 50% • 1000-Hour Fuel Moisture - Dead fuels ranging from 3” to 8” in diameter. Value is based on running 7-day average. Impacted by 24-hour Max/Min Temp, Max/Min RH and precipitation duration values for a 7-day period. Value range: 1 - 40%
Energy Release Component The Energy Release Component is a number related to the available energy within the flaming front at the head of a fire. Daily variations in ERC are due to changes in the moisture content of the fuels present, both live and dead. As live fuels cureand larger dead fuels dry, ERC values get higher. The 1000-hr Fuel Moisture is one of the primary inputs into the ERC calculationand as such, 24-hour Max/Min Temperature, Max/Min RH and Precipitation Duration all affect the calculation. Since wind and fine fuel moisture do not affect the ERC calculation, the daily variation is relatively small. The ERC scale is open-ended or unlimited and is heavily dependent on the fuel model that is being used. Historically on the Prescott NF, the highest ERC values in the G fuel model have been around 110, while the highest ERC values in the B fuel model have been around 150.
PNF Fire Activity - 2019 Fire Size Class A: 0 - .25 B: .26 - 9.9 C: 10 - 99 D: 100 - 299 E: 300 - 999 F: 1000 - 4999 G: 5000 + • Agency Assists: 14 (0 in the last week) • False Alarm Response: 24 (2 in the last week) • Abandoned/Illegal Campfires: 83 (5in the last week)
Fire Potential Outlook July & August


