Download
1 / 20
200 likes | 237 Vues
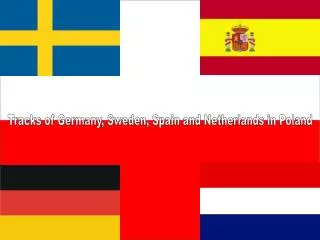
This article compares the wind energy policies and developments in Denmark, Sweden, and Spain, highlighting key features, challenges, and support schemes.

E N D
WIND POLICIES IN DENMARK, SWEDEN AND SPAIN • Energy is on the agenda of most countries in the world. • Main problems: long-range supply security, ”oil peak”, global warming. • These problems were not in focus when liberalising the EU electricity market in 1996: only low consumer prices. • 10 years of experience has exposed a number of problems in addition to the above mentioned: e.g. lower utility priority to maintenance and technical innovation. • Long range planning is needed, but the market has a short time horizon. This is not consistent. Niels I. Meyer Cardiff Conf. Sept.3, 2006
NUCLEAR POWER • The EU Commission is reconsidering nuclear power. • But: Unsolved security problems, no safe deposit of high level waste, limited uranium resources, potential for nuclear weapons - and manipulated cost claims. • Far from full insurance cost, underestimated cost for removing of old plants, hidden state subsidies through cheap investment loans and export credits. • EU has subsidised nuclear power by more than 60 billion euros over the years. Niels I. Meyer Cardiff Conf., July 3, 2006
HISTORICAL DANISH WIND ENERGY POLICY • Long historical development: Poul la Cour in the 1890s. • Rotor diameter of 22 m with mechanical speed control. • Testing of rotor profiles in wind tunnel. • Producing hydrogen by electrolysis of water (for illumination). • In 1918, 120 rural wind power stations in Denmark with a total capacity of 3 MW, covering 3% of Danish demand. • 200 kW Gedser mill in operation 1959 to 1967: three blades on a horizontal axis in upwind position. Niels I. Meyer Cardiff Conf., July 3,2006
MODERN PHASE OF DANISH WIND POWER • Startíng in the mid seventies with the Gedser Mill as the ”mother concept” promoted by small private entrepreneurs. Turbine capacities beginning at 22 kW. • Support from the Danish Academy of Technical Sciences and Danish NGO’s. • Ridiculed by utilities and supporters of nuclear power. • Heated debate on nuclear power from 1974 to 1985. • Official plans (1976,1981), alternative plans (1976, 1983) • Supporters of RES and opponents of nuclear power were accused of trying to overthrow Danish democracy. Niels I. Meyer Cardiff Conf., July 3, 2006
MAIN FEATURES OF DANISH WIND ENERGY POLICY • 1976 to 1990: modest room for wind in official plans, voluntary agreements between utilities and wind energy producers, some state support for research/development • 1990: New energy plan with main goal: sustainable energy development. Follow-up in 1996. • 1992: State rules for wind tariffs and grid access. • 1994 to 2002: Rapid growth in installed wind capacity. • 2003-2006: Stagnation in new wind capacity after change of Danish government i 2001. Niels I. Meyer Cardiff Conf., July 3, 2006
STRATEGIC ELEMENTS OF DANISH WIND POLICY • Long-term government support for R&D. • Early national tests and certification of wind turbines. • Safe technological development from small to large size. • Siting rules caring for the environment and dwellings. • Local ownership of wind turbines, mainly co-operatives – 150,000 households involved in 2002. • Favourable feed-in tariffs from 1992 to 2002: 8 euc/kWh. • Specified and ambitious targets for RES-E in official energy plans from 1990 and 1996: 1,500 MW wind in 2005 and 5,500 MW in 2030 (4,000 MW offshore). Niels I. Meyer Cardiff Conf., July 3, 2006
YEARLY GROWTH OF WIND CAPACITY IN DENMARK • Green columns indicate number of turbines, while yellow curve indicates yearly installed capacity (MW). Net increase in capacity close to zero from 2004 to mid 2006. Niels I. Meyer Cardiff Conf., July 3, 2006
MAIN FEATURES OF SWEDISH WIND DEVELOPMENT • Late and limited interest from Swedish government and utilities for wind power. • Early technological state support for MW turbines only. • Slow and bureaucratic permission procedures. • Focus in RES-policy on biomass rather than on wind. • Unsuccessful introduction of scheme with trading of green certificates. • Recent streamlining of green certificates scheme and increasing interest in wind power from utilities. Niels I. Meyer Cardiff Conf., July 3, 2006
COMPARISON BETWEEN SWEDEN AND DENMARK Niels I. Meyer Cardiff Conf., July 3, 2006
SWEDISH SUPPORT SCHEMES FOR WIND POWER • Investment subsidies from 1991 to 2002 ranging from 35% to 15% - resulting in 290 MW installed in 2002 . • New scheme: Trading of green certificates introduced in 2003. • No success due to lack of stable and long-range framework conditions. • Adjusted scheme from 2006 running to 2030 with 15 years contracts for certificates. • Negotiations for a common certificates market with Norway has been closed in early 2006. Niels I. Meyer Cardiff Conf., July 3, 2006
MAIN FEATURES OF SPANISH WIND DEVELOPMENT • First Spanish state support for wind related to law about energy conservation (1980). • First Spanish grid connected wind farm (600 kW) in 1984 • Late start on real Spanish wind development (only 100 MW in 1995) mainly due to varying support schemes. • After 1995, the Spanish growth rate for wind power has been among the highest in the world resulting in more than 10,000 MW installed capacity at the end of 2005. Niels I. Meyer Cardiff Conf., July 3, 2006
ACCUMULATED SPANISH WIND CAPACITY Niels I. Meyer Cardiff Conf., July 3, 2006
KEY ACTORS IN SPANISH WIND POWER • Governmental actors: Institute for Energy Diversification and Saving (1984) and National Energy Regulatory Authority (1998). • Developers Associations: Association of Renewable Energy Producers (1987) with about 300 members. • Regional governments in Autonomous Communities. • Second largest power utility, Gamesa Eólica owns 3,000 MW wind plus 15 production sites (number two in world). • Wind Energy Enterprise Association (2002), large corp. Niels I. Meyer Cardiff Conf., July 3, 2006
PLANNING OF WIND POWER IN SPAIN • First comprehensive energy plan (1991) with a target of 175 MW wind capacity in year 2000. The realised capacity was 2,500 MW! • Subsequent plans in 1999 (9 GW by 2010), 2002 (13 GW by 2011) and 2005 (20 GW by 2010). • Spanish wind industry wants to increase this target further, but this will demand strong technical requirements for turbines (e.g. overcoming voltage dips on the grid and entering delegated dispatch centers). Niels I. Meyer Cardiff Conf., July 3, 2006
ECONOMIC SUPPORT SCHEMES IN SPAIN • From 1980 to 1994 varying and uncertain economic schemes. • New electricity law in 1994 introducing five year contracts and tariffs set by governmental Royal Decree. • Tariffs from 1995-1998: 6.5 to 6.9 eurocents/kWh. • After liberalised market in 1996 RES producers may choose between different alternatives: Pool system, bilateral contracts and ”special regime” (with a specified tariff). • Since 2004 market oriented energy policy but with favourable tariffs. Tender system for offshore farms. Niels I. Meyer Cardiff Conf., July 3, 2006
COMPARISON: DENMARK, SWEDEN AND SPAIN • Denmark pioneered modern phase of wind power and has still the worlds highest coverage by wind (19%). • The Swedish government and Swedish utilities have shown only modest interest in wind until recent years. • Spain has experienced a slow growth in wind power capacity until the mid 1990s where an extraordinary high growth rate took off. • In 2006, wind power is stagnating in Denmark, blooming in Spain and wakening up in Sweden. Niels I. Meyer Cardiff Conf., July 2006
EXPLAINING FACTORS FOR DENMARK • Historical tradition and step by step increase in capacity. • Alliances between NGOs and academic institutions. • Early test and certification institution at Risø and early state support for R&D including offshore farms. • Local ownership of turbines (150,000 households). • Private industrial entrepreneurs leading to large production plants in the 1990s. • Far-sighted government plans from 1990 and 1996 including ambitious capacity targets. • Stagnation from 2003 due to conservative-liberalistic government with fundamentalistic market policy. Niels I. Meyer Cardiff Conf., July 3, 2006
EXPLAINING FACTORS FOR SWEDEN • Questionable choice of turbine technology (MW range) from the outset. • No strong driving forces for wind power. • No successful national production of wind turbines. • Bureaucratic procedures for plant permissions. • More focus on biomass than on wind. • Recent streamlining of scheme for trading of green certificates may create hígher growth rates. Niels I. Meyer Cardiff Conf., July 3, 2006
EXPLAINING FACTORS FOR SPAIN • Uncertain and short range support schemes for the period up to mid nineties. • No significant turbine production until late nineties. • Strong incentives from feed-in scheme after mid nineties. • Support from Autonomous Communities and some utilities like Iberdrola. • Increasing electricity demand: extra room for wind. • Dependence on imported fossil fuel and Kyoto commitment support shift to wind power. Niels I. Meyer Cardiff Conf., July 3, 2006
CONCLUSIONS • Governmental energy policy is a decisive factor for penetration of wind power. • Favourable feed-in schemes have so far proved to promote wind power most efficiently. • A sustainable energy development requires fluctuating RES as a significant element in the supply system, e.g. 50% before 2030. • High fractions of fluctuating RES-E require these plants to actively support the overall system balance. • Development of such systems should have high priority. Niels I.Meyer Cardiff Conf., July 3, 2006