Labor Demand
Labor Demand. Overview. In the next few chapters we will consider the demand for resources. Just as a coin has two sides, when viewing a firm we could focus our attention on 1) the good or service being made, as we have already done, or


Labor Demand
E N D
Presentation Transcript
Overview • In the next few chapters we will consider the demand for resources. Just as a coin has two sides, when viewing a firm we could focus our attention on • 1) the good or service being made, as we have already done, or • 2) the resources or inputs being acquired and used to make those resources. • We will look at two contexts just like we did before: • The short run when only labor can be varied in amount, and • The longer term when all resources can be varied in amount.
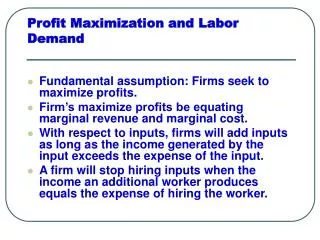
Overview Firms or businesses are profit maximizing entities (or so assumed in economics). As such, the only reason labor is demanded (or any other resource for that matter) is because labor helps produce the good(s) and/or service(s) the firm wants to sell. Labor demand is a derived demand – derived from the firm’s desire to sell output. (Should firms have to hire labor merely because they can?) In this section we study some economic concepts that influence how much labor the firm desires. We begin with a view of the short run.
The production function We will assume that firms employ both labor and capital in the production process, one type of output is made, the quality of workers is basically the same, and our emphasis is on the number of workers demanded. In a shorthand notation we say q = f(L, K) Where q = the amount of output, L = the amount of labor used, K = the amount of capital used, and f means output is a function of, or depends on, the amount of capital and labor used.
Marginal Product The marginal product of labor – MPL – is defined as the change in output resulting from hiring an additional worker, holding constant the quantities of other inputs used. We usually calculate a number to tell us about MPL for each unit of labor. Take the change in output and divide by the change in labor, taking labor one unit at a time.
Cookie factory Imagine this room is a cookie factory - like at a shopping mall. The fixed input, or capital, is the production facility and it includes a certain number ( say two of each, for now) of refrigerators, bowls, mixers, ovens, tables and other stuff. The variable input will be labor. We will observe output levels at various levels of labor used. If the amount of capital were to change, we would likely have a whole new set of numbers.
Example continued This is just an example where we have added labor to a fixed amount of capital. Total output in this example will be measured in dozens of cookies per hour. How did I get the total output column? In this case I think I used an example from another book that I used to read from time to time and at this time I can not remember the author(s) of the book. My point for you is to take the numbers as a given.
MP or marginal product • MP is the additional output from adding the additional worker. Note we go from line to line. SO the MP = 15 when units of labor is 2 is found by (25-10)/(2-1) =15. Do you see how all the other MP numbers were found? • As more of the variable input is used with a fixed input, the marginal product first increases, reaches a maximum, then diminishes and even becomes negative in this example. The main point for us will be the diminishing portion of the marginal product.
MP - continued • MP is a max. at 2 units of labor and begins to diminish with the 3rd unit of labor. • As more labor is added there is less and less tools - capital - to use, so additional workers can not add as much output as previous workers.
AP or average product • At an output level AP = (total output)/(amount of labor used). For example when units of labor is 2 we get 25 units of output and thus AP = 12.5. • Do you see how the other AP figures are found?
Law of diminishing returns (I already mentioned this point, but let’s review) You have probably noticed that the marginal product column first has a rising marginal product (as you go down the column and use more labor), then the marginal product reaches its peak, and then the marginal product declines – you should always use the word diminishes! What is the reason for this phenomenon? Economists believe, because of studies of the production process, when firms have a fixed amount of capital the first units of labor can specialize tasks and actually produce increasing returns, but at some point as more labor is added to the fixed amount of capital, there will not be as much capital for the additional workers to use and thus their contribution to output will diminish relative to the earlier workers.
Cookie factory again Have you ever made cookies without a mixer? If you have and then made some with a mixer you know how much nicer it is to use a mixer. Per time period you could make more cookies with a mixer than without one. Now, the more workers the more likely it is there are no mixers to use and thus additions to output diminish. By the way, here I am just talking about production possibilities at this one firm. The firm will end up doing only one of the possible amounts in a period of time. (Firms are like some people – can’t walk and chew gum at the same time- get it?)
Perfectly Competitive Firms For now we will assume that firms are too small to have the ability to make what price they would like to sell their output for or what price they would like to pay for labor or capital. This is the assumption of perfect competition in both the input market and the output market. The point here is some firms simply have to follow what is going on in the market, or they will not be able to survive. Let’s assume the output can be sold for $2 per unit. At this point I think it might be good to review some things we have already gone over.
Graphs Note that these two graphs are based on the numbers from the example we had in the table. I only went to 8 units of labor. On the left we have total output. Notice how the increase in total output is slowing down in the graph on the left. Because of this the graph on the right has the downward sloping part. The two graphs are related – can you see how? Also notice, PLEASE, the two graphs here place units of labor on the horizontal axis.
Table explained When we focus on the firm making output in a competitive market (or as we well see in a noncompetitive market) we might calculate total revenue (TR) or marginal revenue (MR). On the horizontal axis we would put total output or quantity amounts and we would put the revenue amounts on the vertical. Recall that TR = P times Q and here we assume P = 2. So, when output is 37, for example, TR = 74. MR is just the change in total revenue as we change output. For example, in the line were total output is 37 we have MR = 2 because when we look at the previous line when output was 25 we have (74 – 50)/(37 – 25) = 24/12 = 2. Do you see how the other numbers were obtained?
More graphs In these graphs the focus is on units of output and revenue concepts. We have already seen these graphs. Recall in a competitive market when the firm is a price taker the firm uses the market price and thinks about what its revenue might be. Here the price is assumed to be 2 and thus P = 2 = MR.
The Marginal Revenue Product The marginal revenue product (MRP) is the change in total revenue as you change units of labor. The focus is again on units of labor. For example, when the labor amount is 6 the MRP is 10 because (120 – 110)/(6 – 5) = 10. Do you see how the other numbers are found? So the marginal revenue is the change in total revenue looked at from the perspective of changing output, while the marginal revenue product is the change in total revenue looked at from the perspective of changing labor. Remember when we change labor we change output. So MR and MRP are related.
Graph of MRP Notice here that we have units of labor on the horizontal axis. Let’s remember everything we have done so far is based on an example with a certain amount of output per worker (what we like to call productivity) and output price of 2. If either should change we would have to change all the numbers we have been working with.
Labor demand You may recall that we looked at MR for the firm and then compared MR with MC to determine how much output to make. Now we will look at MRP and compare it with a cost idea that will be introduced momentarily and we can see how much labor the firm will wish to hire – the demand for labor by the firm. The marginal resource cost, MRC, is the addition to cost from adding a unit of the variable input, here labor. Recall we said the firm here is a wage taker. This means it must accept the wage in the market and thus for each worker it hires its MRC will be the wage.
MRP and MRC graphed together PLEASE notice on the previous slide that I made the fixed cost of capital $10 (when output equals zero in the short run we still have to pay fixed cost), and I made the cost of labor $6 per unit (because let’s say that firms have to pay this to get labor.)
MRP = MRC rule If a firm wants to maximize profit it will hire labor up to the point where the MRP = MRC. Look back at the graph. The first unit of labor has MRP > MRC. So the firm will want the first unit of labor. The second unit of labor has MRP > MRC. So the firm will want the second unit of labor. Does the firm want the eight unit of labor? NO, at that point MRP < MRC. At the seventh unit of labor we see MRP = MRC.
MRP = MRC rule Note when the wage is $6 here all the units of labor from 1 to 6 add more to revenue than cost (MRP > MRC) and thus add to profit. Also the labor units of 8 or more add more to cost to revenue (MRP < MRC) and thus decrease profit. Here at 7 units of labor the MRP = MRC and so as much is added to revenue as to cost and thus the firm really doesn’t add to profit but it doesn’t lose anything either. But we say if there is a tie take the unit of labor. Thus firms demand labor up to the point where MRP = MRC.
MRP = MRC rule Recall that when we looked at output at a competitive firm we said make output up to the point where MR = MC. From the point of view of hiring labor we have the firm hiring labor up to the point where MRP = MRC. Why look at the other side of the same coin? To get a different perspective! Remember firms need labor to make output. SO while it is making output it is hiring labor and through this work here we see how the two are related.
An editorial note It seems to me that many folks who what to criticize what is happening in our economy do not see the connection between output and labor demanded. But as you can see the concepts are linked! This is a free country and folks can criticize all they want. But, you now know some folks ignore or are ignorant about the economics.
Another graph of MRP, MRC In this graph I have assumed the wage in the market is not $6, but $16. Would the firm want the 6th and 7th units of labor anymore? Not now! On those units now we see MRP < MRC and thus these units are no longer profitable.
A more generic story dollars The MRP is basically telling us about revenue changes as we add workers (and hence output). Notice MRP diminishes just like MP. I have dollars on the vertical axis. MRP is a dollar amount. MRP Number of workers or units of labor
The cost of more labor Since the firm is a wage taker, ever time it uses another worker its cost goes up by the wage. In a graph similar to previous screen we have: The wage, or MRC, is telling us about how cost changes as we take on more workers. dollars wage Number of workers
Employment decision by the firm in the short run A firm that wants to maximize profit should always hire another worker if the revenue generated by that worker is greater than the cost of that worker and it should never hirer another worker if the revenue of that worker is less than the cost of that worker. What should it do in the case of a tie? We say hire that worker.
Employment decision by the firm in the short run dollars W1 W2 L1 L2 Number of workers
Employment decision by the firm in the short run On the previous slide I showed two wages. Remember the firm is a wage taker and therefore can not influence the wage. I just show two possible such wages. Once we have a wage we can see the firm would hire the amount of labor indicated on the marginal revenue product curve at that wage. The demand for labor by a firm is the downward sloping segment of the MRP curve.