Download
1 / 45
450 likes | 591 Vues
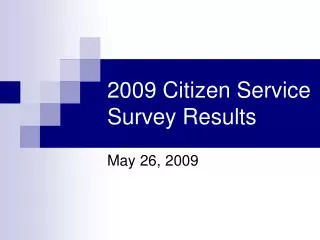
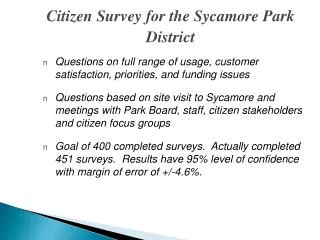
Citizen Survey for the Sycamore Park District. Questions on full range of usage, customer satisfaction, priorities, and funding issues Questions based on site visit to Sycamore and meetings with Park Board, staff, citizen stakeholders and citizen focus groups

E N D
Citizen Survey for the Sycamore Park District • Questions on full range of usage, customer satisfaction, priorities, and funding issues • Questions based on site visit to Sycamore and meetings with Park Board, staff, citizen stakeholders and citizen focus groups • Goal of 400 completed surveys. Actually completed 451 surveys. Results have 95% level of confidence with margin of error of +/-4.6%.
Presentation • Sycamore Park District Today • Sycamore Park District “Community Vision” for the Future” • Funding for the “Community Vision”
ETC Institute- More than 600 Parks and Recreation Assessment Surveys in 46 States WA ND MT OR SD MN WY WI NE IL ME NV UT VT IA MI CA KS CO PA CT MA MO MO IN MD NY KY AR OH AZ OK VA TN SC TX MS AL GA FL Benchmarking Comparisons to National and Illinois Clients
Leisure Vision Illinois Clients Include: • Wheeling Park Dist. • Champaign Park Dist. • Mundelein Park Dist. • Schaumburg Park Dist. • Elk Grove Park Dist. • Highland Park District • City of Rock Island • Geneva Park District • Winnetka Park Dist. • Gurnee Park Dist. • River Trails Park Dist. • Hoffman Estates • Deerfield Park Dist. • Lindenhurst Park Dist. • Carol Stream Park Dist. • Urbana Park Dist. • Downers Grove Park Dist. • Lisle Park Dist • Freeport Park Dist. • Northbrook Park District • Park District of Oak Park • Des Plaines Park Dist. • Glenview Park District • Sugar Grove Park Dist. • Lake Bluff Park District
Cross Tabular Analysis • Household type (with children and without) • Age of respondents • Gender • Program participation • YMCA membership • Level of satisfaction with value received • Amount of additional taxes willing to pay • Voting
Major Findings-Current System • Usage of the Parks is High • Trails and Playgrounds are Most Used Facilities • Over 80% of Households Rate Conditions of Parks as Excellent or Good • Opportunities Exist to Increase Program Participation • 22% of Households are Members of the YMCA • Usage of the Hopkins and Sycamore Pools Are Fairly Equal
Major Findings-Community’s Vision for the Future System • Walking and biking trails are the facilities that households have the most need for and are most important to households. • Outdoor swimming pools are most important to households with young children. An 18 hole golf course is most important for households with no children and all adults 55 and over. • A new outdoor swimming pool with features most desired by household respondents would substantially increase usage. • Over 80% of households would use an indoor community center with the features that are most important to them.
Major Findings-Funding for the “Community Vision” • Respondent households are supportive of partnering efforts, particularly with the Sycamore School District. • Build a new Indoor Community Center, Improve Existing Parks, Develop Additional Walking/Biking Trails, and Build a New Sycamore Pool are Actions Respondent Households Would Be Most Willing to Fund With Park District Tax Dollars • 58% of Respondent Households Would Pay Some Level of Tax Increase to Build and Operate the Types of Outdoor and Indoor Parks, Trails, Aquatics, Sports and Recreation Facilities Most Important to Their Household. • 56% of Respondent Households Would Vote in Favor or Might Vote in Favor of Some Level of Tax Increase to Build and Operate the Types of Outdoor and Indoor Parks, Trails, Aquatics, Sports and Recreation Facilities Most Important to Their Household. 25% Would Vote Against and the Remaining 19% are Not Sure.