Comprehensive Overview of GIS Data Models and Spatial Analysis
350 likes | 397 Vues
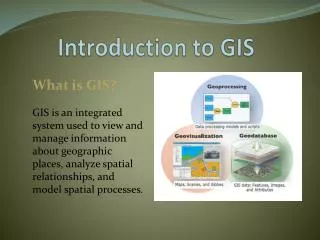
Explore vector and raster data models, scale issues, relational database structures, file formats, and more in this informative guide to Geographic Information Systems (GIS).

Comprehensive Overview of GIS Data Models and Spatial Analysis
E N D
Presentation Transcript
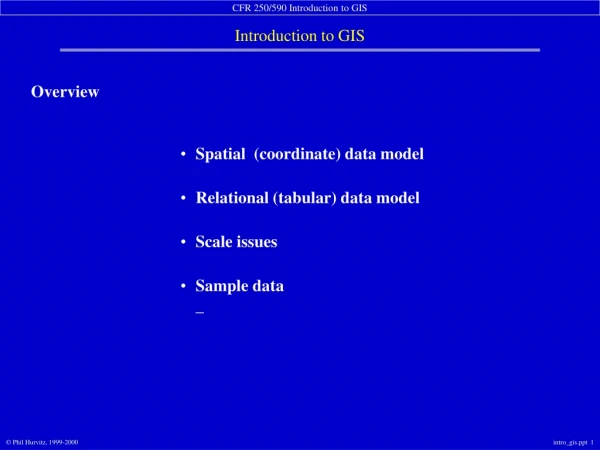
Introduction to GIS Overview Spatial (coordinate) data model Relational (tabular) data model Scale issues Sample data_
Spatial Data Model • GIS are driven by spatial data • 2 basic spatial data models exist • vector • points • lines • polygons • raster • grid cells (images, bitmaps, DEMs)_
Vector Data Model • Characteristics of the vector data model: • Features positioned accurately • Shape of features represented correctly • Features represented discretely (no fuzzy boundaries) • Complex data structure (especially for polygons)_
Vector Data Model Points: represent discrete point features
Vector Data Model Lines: represent linear features
Vector Data Model Lines: represent linear features • Lines start and end at nodes • line #1 goes from node #2 to node #1 • Vertices determine shape of line_
Vector Data Model Polygons: represent bounded areas
Vector Data Model Polygons: represent bounded areas Polygon #2 is bounded by lines 1 & 2 Line 2 has polygon 1 on left and polygon 2 on right_
Vector Data Model Polygons: represent bounded areas complex data model “arc/node topology”_
Vector Data Model Types (formats) of vector data available in ArcView ArcView shapefiles ArcInfo coverages and libraries CAD files (AutoCAD DWG, DXF;Microstation DGN) StreetMap files Spatial Database Engine (SDE) data ASCII point coordinate data_
Vector Data Model ArcView shapefiles • A relatively new vector data format • Preferred in ArcView • Draws fast • Fully editable in ArcView • Simple in structure • Does not use arc-node topology • “Connected” lines do not necessarily share a common node • Adjacent polygons do not share common bounding arcs • Data sets are either point or line or polygon_
Vector Data Model ArcInfo coverages A commonly found format Data model more complex Draws more slowly in ArcView Coordinate data not editable in ArcView Can be used in both ArcView and ArcInfo Polymorphic Problematic file structure (more on this later in the term)_
Vector Data Model AutoCAD & Microstation CAD drawing data • CAD data are very common (industry standard) • DXF, DWG, and DGN formats supported in ArcView • Coordinate data not editable in ArcView • Frequently contain “sloppy” data • No enforced topology rules • Gaps in data • Frequently contain little or no useful attribute data_
Vector Data Model ASCII coordinate data • Easy to obtain from a variety of sources • GPS • Traverse • Direct reading from maps • OS, architecture, and application independent
Raster Data Model Characteristics of the raster data model: Rectangular grid of square cells Shape of features generalized by cells Continuous (surface) data represented easily Simple data structure_
Raster Data Model Raster data are good at representing continuous phenomena Wind speed Elevation, slope, aspect Chemical concentration Likelihood of existence of a certain species Electromagnetic reflectance (photographic or satellite imagery)_
Raster Data Model Raster spatial data model origin is set explicitly cell size is known cell references (row/column locations)are known cell values are referencedto row/column location values represent numerical phenomena orindex codes for non-numerical phenomena_
digital orthophoto digital elevation model (DEM)_ Raster Data Model A few different types of raster data
Relational Database Model & Attribute Data Structures • The “where” of GIS is determined by coordinate (map) data structures, but … • The “what” of GIS is determined by tabular (relational database) data structures • Thus, tabular data are just as important as coordinate data_
Relational Database Model & Attribute Data Structures Attribute data are stored in database tables. • Tables are composed of: • fields and • records_
Relational Database Model & Attribute Data Structures You may already be familiar with relational databases dBase rBase Access Excel (database functionality) Oracle, INFORMIX, INGRES, SQL Server INFO (in ArcInfo)_
Relational Database Model & Attribute Data Structures ArcView uses tabular data formats from dBase, ASCII text, and INFO files • tables are stored on the disk as • .dbf, • .txt, or • in INFO directories_
Relational Database Model & Attribute Data Structures Tables can be linked and joined (“related”) by use of common values in fields
Relational Database Model & Attribute Data Structures Different types of attribute tables in ArcView • Vector • point attribute tables • polygon attribute • line attribute • node attribute* • text attribute* • route & event tables* • Raster • value attribute_ * in ArcInfo coverage data only
Relational Database Model & Attribute Data Structures Relationship between tabular and map data one-to-one between features and records_
Scale Issues Scale of data plays an important role, and frequently causes problems Be aware of: Data’s source scale Mixing data from different source scales Appropriateness of output scale_
A 1/40th in line on a 1:24,000 scale map is 50 ft on the ground A .30 mm line on a 1:200,000 scale map is almost 2,000 ft on the ground_ Scale Issues Map measurement and true ground measurement
Scale Issues Data from different sources and scales can vary widely 1:100,000 scale data from USGS DLG
1:1,000,000 scale data from DCW (DMA) Scale Issues Data from different sources and scales can vary widely
Scale Issues Data from different sources and scales can vary widely 1:2,000,000 scale data from USGS DLG
Scale Issues Beware of scale statements “one to two-hundred”: does this mean • one inch on the map equals 200 inches on the ground? or • one inch on the map equals 200 feet on the ground?_
Course Sample Data Pack Forest GIS database • Original data sources • Legacy maps • USGS digital line graphs • DNR data • GPS surveys • Digital orthophoto interpretation_
Course Sample Data Pack Forest GIS database • CD directory pfdata • Forest stands • Streams • Roads, trails • Soils • Elevation contours • Culverts • Forest inventory data • Digital orthophotos • Digital elevation model • …_
Course Sample Data ESRI Sample Data • CD directory esridata • Worldwide data sets • countries • major rivers • United States data • states • counties • cities • rivers • roads • Canada • Mexico_
Sample Data Pack Forest GIS database projection & coordinate definition Unless otherwise specified, Projection STATEPLANE Washington South Zone (State Plane 5626 or FIPSZone 4602) Datum HPGN (a.k.a. NAD83/91) Units FEET Spheroid GRS1980_