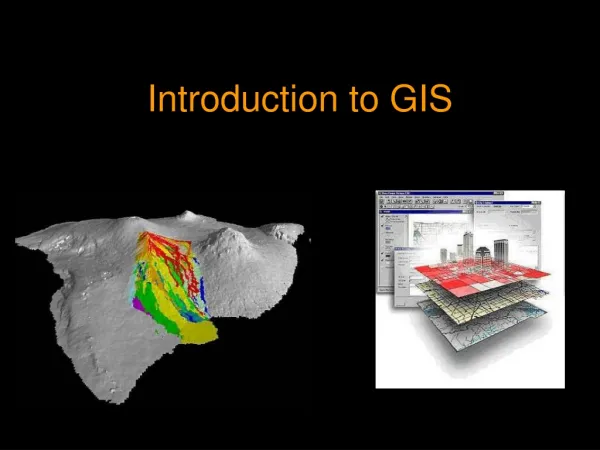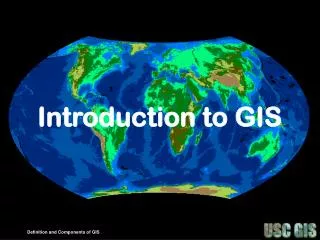
Introduction to GIS
Introduction to GIS. What is GIS?. Stands for “Geographic Information System” For display and analysis of geographic information with computers Also known as “computer mapping”. Types of GIS Symbols. Type Symbol Example. Points Lines Polygons

Introduction to GIS
E N D
Presentation Transcript
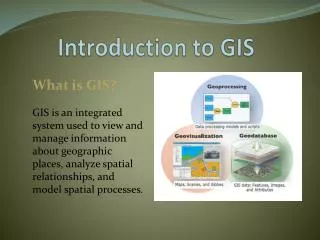
What is GIS? • Stands for “Geographic Information System” • For display and analysis of geographic information with computers • Also known as “computer mapping”
Types of GIS Symbols Type Symbol Example • Points • Lines • Polygons • Images • Towns, points of interest, campgrounds,… • Rivers, roads, railroads,… • States, countries, boroughs,… • Satellite image, topographic map, shaded relief,… Image source: MapTEACH
Roads Villages Rivers Airports Vegetation Themes and Layers • GIS organizes information into layers • Layers represent different “themes” • A GIS map may have one or more layers Image source: MapTEACH
Sedimentary Basins National Parks Topography Museum Locations Example Thematic Maps Image sources: http://www.nps.gov http://www.usgs.gov http://www.mapsofworld.com http://www.asgdc.state.ak.us/
How is GIS Used? • Navigation • Emergency response • Natural resource management • Military • Business analysis • Education • And many more… Image sources: http://www.dot.state.al.ushttp://www.cattlab.umd.edu
Why use a GIS? • GIS maps are dynamic (can be changed). • Any information that has a location component can be mapped. • A GIS anchors information to its real-world location on a map. • We can display, measure, and compare features.
From Sphere to Flat Map • The Earth is a slightly squished sphere • We can describe any location with degrees of Longitude: vertical lines W E of zero (prime meridian)Latitude: horizontal parallel lines N ↕ S of zero (equator) • A globe is a model of the Earth Image sources: http://sevencolors.org http://www.astro.columbia.edu http://www.eearthk.com
From Sphere to Flat Map • One simple way is to make a grid of latitude and longitude. • Then you can plot locations like x and y on graph paper. • This is called the “geographic coordinate system.” • The coordinate system is based on an approximation of the shape of the Earth (or “datum”). • Since the Earth is irregular, the surface is changing (continental drift), and we have gotten better at measuring it. • There are many “datums” to go with the geographic coordinate system. • For Alaska, the most common datums are: • WGS84 (World Geodetic System 1984) • NAD83 (North American Datum 1983) • NAD27 (North American Datum 1927) Image source: MapTEACH
Why Make a Flat Map? • The globe doesn’t fit in my desk drawer or my pocket. • The globe doesn’t work very well for mapping detail. • It is hard to measure distances and areas on a curved surface. • So what do we do? • Get the computer to “project” the map with mathematics. Image source: http://www.kidsgeo.com and http://kartoweb.itc.nl
a. b. c. d. Which Projection? • There are many,many projections to choose from. • Most common types are: • Cylindrical • Conic • Planar • Transverse Cylindrical • Each projection distorts • Your choice depends: • on the theme or purpose of your map • the scale (large or small detail) • the location of the area on the Earth Image source: http://www.NationalAtlas.gov
Which Projection? • For Alaska, we use two basic types: For Statewide small-scale data:“Albers Equal Area Conic - Alaska” For Local large-scale data:“Universal Transverse Mercator” (UTM) Image source: MapTEACH
Types of GIS Files Type Symbol Example • Points • Lines • Polygons • Images “Vectors”(shapefiles, .shp, .dbf, shx, …) • Towns, points of interest, campgrounds,… • Rivers, roads, railroads,… • States, countries, boroughs,… • Satellite image, topographic map, shaded relief,… “Raster files or image files”(.jpg, .gif, .tif, .png, .bmp, …) Image source: MapTEACH