Download
1 / 52
800 likes | 988 Vues
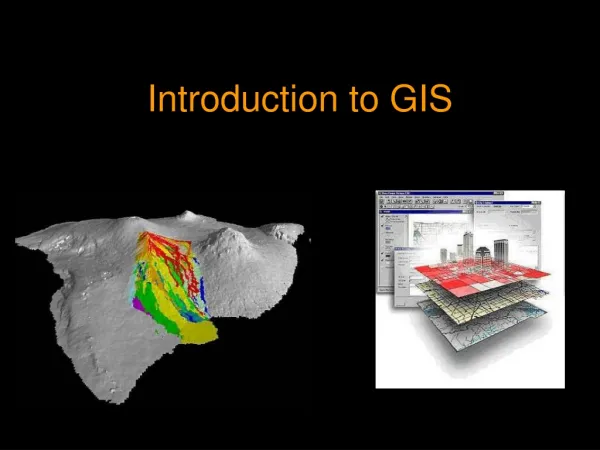
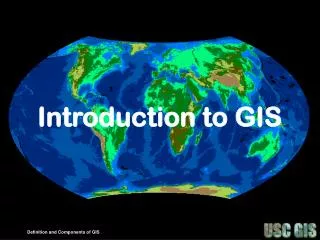
INTRODUCTION TO GIS. Geographic + Information + System. Knowledge of proper geographic location is an important aspect in this technically advanced and competitive market.

E N D
Geographic + Information + System Knowledge of proper geographic location is an important aspect in this technically advanced and competitive market. Information is the result of processing, manipulating and organizing data in a way that adds to the knowledge of the person receiving it. A collection of entities organized in a manner to cooperate with each other in order to accomplish a common objective.
G-Geographical I-Informstion S-System
G-Geographical I-Information S-Science
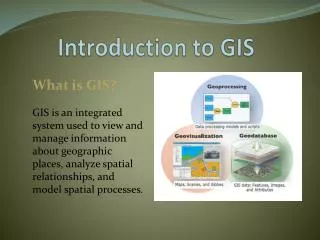
GIS or Geographical Information Systems is broadly a computer capable of assembling, storing, manipulating and displaying geographically referenced information. Practitioners also regard the total GIS as including personal and the data that go into the system. Defining GIS is a tough task though not an impossible one. This is more evident from the following definitions. GIS is … … a system for capturing, storing, checking, integrating, manipulating, analysing and displaying data which are specifically referenced to the earth. (Charley 1987)
GIS is … … an information technology which stores, analyses and displays both spatial and non-spatial data. (Parker 1988) …an institutional entity, reflecting an organisational structure that integrates technology with a database, expertise and continuing financial support over time. (Carter 1989) … an information system that is designed to work with data referenced by spatial or geographic coordinates. A GIS is thus both a database system with specific capabilities for spatially referenced data as well as a set of operations for working with data. (Star & Estes 1990)
… a system of computer software and procedures designed to support the capture, management, manipulation, analysis and display of spatially referenced data for solving complex planning and management problems.
So.. What’s a GIS? ...a computer based system to capture, store, edit, manipulate, analyze, synthesize and display geographically referenced information 8
GIS converts digital data into maps GIS defined... ...a computer system capable of visualizing data which describe places on the earth’s surface Digital data is expressed as numbers 9
GIS defined... With GIS you can do more than just view maps, you can also query and analyze map layers simultaneously 10
Need of GIS? Many professionals, such as foresters, Army, urban planners, and geologists, have recognized the importance of spatial dimensions in organising & analysing information. Whether a discipline is concerned with the very practical aspects of business, or is concerned with purely academic research, geographic information system can introduce a perspective, which can provide valuable insights as 70% of the information has geographic location as it's denominator making spatial analysis an essential tool. *Ability to assimilate divergent sources of data both spatial and non-spatial (attribute data) *Visualization Impact *Analytical Capability *Sharing of Information
GIS Functions Input: adding data or creating new data Manipulation: updating or reformatting data Query: two methods - query the database (tabular data) or query the geographic features (spatial data) Analysis: combining multiple types of data over an area to answer questions or to develop scenarios about that area Visualization: creating 2D maps or 3D representations Management: spatial and tabular data 12
Questions a GIS can answer... Location Where is it? Condition What is at... ? Trends What has changed since... ? Patterns What spatial patterns exist? Modeling What if... ? continued... 13
Questions a GIS can answer... ProximityWhat are the characteristics of the area around existing features? Boundary Operations What exists within a specific region? Logical OperationsWhat is unique about a region or set of features? 14
WHAT DOES GIS DO • Collect, store, organise and distribute data • Criteria matching: Select a suitable site for picnic that is: • on public land; • with gentle slope; • amongst shaded trees; • within 50 m of canoe-able river • A restaurant within 200 m. • 3.Allows exploration of relationships among data layers: • How does population density relate to water availability • High yielding Poplar grows on which soil type • … contd.
4. Allows scenario testing: If we raise smoke chimney to 1000 feet, will it go out of the adjacent village If we make the proposed sewage path, will it cut the roads 5. Serve as a data handler for other analyst: Passing water quality and water-table data to groundwater flow model Passing geological and topographic data to soil erosion modeler. 6. Aids Visualisation: It improves understanding and pattern recognition Facilitates public participation in alternative scenario Coordinates group decision making
BUT THE GIS IS NOT • East to use • Just a drafting (CAD) program, it needs analytical capabilities • Able to make decisions- That is the job of the user/interpreter • Free of field work • Cheep in terms of human resources, computer resources and data acquisition
Components of a GIS Data and Information Results and Applications Modeling the Real World Hardware/ Software 19
There are three basic perceptions prevalent in the GIS community Cartographic Perception : Which focuses on the map aspects of GIS. Supporters of this view see GIS as a map processing and display system where each map is represented as a layer, mostly in raster format, and is manipulated by a set of map arithmetic functions. • Database Perception : • emphasizing the importance of a well designed and implemented database. A sophisticated database management system (DBMS) is an integral part of such systems. This view is predominant amongst the GIS community who have computer science background. Application around querying, transaction, processing, large area active database maintenance, map production etc. are suited to this approach.
Spatial Integration Perception : emphasizing the spatial analysis capabilities of GIS. This view focuses on integrated analysis and modeling and seen more as a spatial information science than a technology. It is towards this perception that GIS of present day are developing and is likely to become most widely accepted by the GIS community.
DATA IN GIS • Broadly classified into following categories : • Spatial data • Non-spatial data • Spatial data : • Spatial data has physical dimensions and geographic locations on the surface of earth. Maps are used to graphically represent geographic features of the earth. A map conveys : • Positional information about the location on the surface of earth • Spatial relationship such as adjacent to located within etc. • Measurable quantities such as length, area, latitude, longitude etc.
Non-Spatial data : Data that qualifies the spatial data. It is quantitative data expressed as names, numbers, dates, values etc.
Data Models and Feature Types Vector Points, Lines and Areas Raster cell matrix Y X 25
Types ofData Models- how do you represent the real world in a computer? Raster Data Model Cell or Grid Matrix Continuous Data Vector Data Model Points, Lines, Polygons Discrete Data Real World 26
DATA MODELS Raster Data Structure(Cartographic Map Model ) The simplest raster data structures consist of an array of grid cells (sometimes termed pixels). Each grid cell is referenced by a row and column number and it contains a number representing the type or value of the attribute being mapped. In raster structures a point is represented by a single grid cell; a line by a number of neighboring cells strung out in a given direction and an area by an agglomeration of neighboring cells.
Raster: • A set of cells located by coordinate is used, each cell is independently addressed with the value of an attribute. • One set of cell and associated value is a LAYER. • It is simple with which spatial analysis is easier and faster. • Requires a huge volume of data to be stored, fitness of data limited by cell size .
Vector representation (Georelational Model) Vector representation of an object is an attempt to represent it as exactly as possible. Advantages: Good representation of phenomenological data structure Compact data structure Topology can be completely described with network linkages. Accurate graphic Retrieval, updating and generalization of graphic and attributes are possible.
Vector • Uses line segments or points represented by their explicit (X,Y) coordinates to identify locations • Discrete objects are formed by connecting line segments which area is defined by set of line segments. • It requires less storage space, outputs are appreciable, estimation of area/perimeter is accurate and editing is faster and convenient. • Spatial analysis is difficult with respect to writing the software program.
CONCEPTS IN GIS Three basic spatial features can be identified : Points Lines Polygons Points: Point locations are used in geography in two ways. The first way is shorthand reference for an area so that a map might show the locations of towns as a scatter of points. The second is as a precise locational reference. For example, the site at which certain measurements are made.
Lines: Individual points can be joined together to form a second type of spatial feature, a line. Minimum number of points needed to define a line over a short distance is two, in which case the line is necessarily straight. However if more than two points are used, line may be curved and the path of the line between individual points area called segments. Start and end points of a line and the point at which three or more lines join are called nodes. Polygons: When a series of lines form an enclosing boundary they create the third type of spatial feature – an area or a polygon. In this case, the number of pairs of x and y coordinates are variable since it depends on the number of lines and number of segments.
RASTER vs VECTOR Raster representation: Set of cells located by coordinates, each cell is independently addressed with the value of an attribute. Advantages: -Simple data structures. -The overlay and combination of mapped data with remotely sensed data is easy. -Various kind of spatial analysis is easy. -Simulation is easy because each spatial unit has the same size and shape. Disadvantages: Volumes of graphic data.
The vector model is extremely useful for describing Discrete features, but less useful for describing continuously varying features such as soil type or accessibility costs for hospitals. The raster model has evolved to model such continuous features. A raster image comprises a collection of grid cells rather like a scanned map or picture. Both the vector and raster models for storing geographic data have unique advantages and disadvantages. Modern GIS packages are able to handle both models.
Comparing Vector and Raster Models Vector Raster • Primary Focus Geographic Feature Location • (Thing) ( Place ) • Question asked “what do I know about “what phenomenon this geographic feature?” occur at this location?” • Representation better for precise or better for continuous data • discrete kinds of features or change in values along a gradient • Accuracy accurate portrayal of feature shape is • feature shape generalized • Modeling capability requires complicated simple mathematic • geometric algorithms combination of cells 35
MAP OVERLAYS Because each cell in a two dimensional array can only hold one number, different geographical attributes must be represented by separate sets of Cartesian arrays, known as ‘overlays’. The overlay idea for separating data is not restricted to computer cartography, having been used by cartographers for preparing printed maps and by landscape planners. The overlays concept is realized by stacking two dimensional array in raster data structures.
Vector data (the streets) laid on top of raster data (the mountains and valley floor).
Organizing Spatial Features in Common Themes Creating data “themes” is basically the process of abstracting or simplifying the real world into different components that can be input into a computer. 38
The GIS Data Model: Geographic Integration of Information Raster Imagery • Data are organized by layers, coverages or themes (synonymous concepts), with each theme representing a common feature. • Layers are integrated using explicit location on the earth’s surface, thus geographical location is the organizing principal. 39
DATA STRUCTURE These are used to organize the data inside the information system. The choice of data structure affects both; Data storage volume and processing efficiency. Types : Relational Hierarchical Network
Relational Data organized in 2-dimensional table Row-> Record Column is Attribute Different tables are related through use of a common identifier called KEY. Relation extracts the information, which are defined by query.
Hierarchical It stores data in a way that a hierarchy is maintained among the data items. Each node can be divided into one or more additional node. Stored data gets more and more detailed as one branches further out on tree
NETWORK Similar to hierarchy structure except that a node may have more than one parent. Each node can be divided into one or more additional nodes. It is limited since pointers must be updated every time a change is made to database.
• Degradation• Crop acreage and production estimation• Wasteland mapping• Soil resources mapping• Groundwater potential mapping• Geological and mineral exploration• Snow-melt run-off forecasting• Monitoring forest fire• Monitoring ocean productivity etc.
Summary GIS is a tool for storage, manipulation and output of spatial data Remote sensing is a primary source of data for GIS GIS is a useful tool for processing remotely sensed data To use GIS effectively you must understand the characteristics of spatial data (e.g. data structures, projections, implications of math algebra, etc.) 50