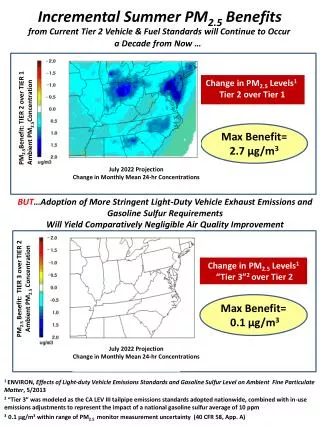
Solutions to Cache Valley PM 2.5 Pollution
510 likes | 650 Vues
Solutions to Cache Valley PM 2.5 Pollution. Jay T. Price Master of Science Candidate, Bioregional Planning Environment and Society Department College of Natural Resources Utah State University 8/3/2010. Overview. Introduction Health and Welfare Effects of PM 2.5 in Cache Valley

Solutions to Cache Valley PM 2.5 Pollution
E N D
Presentation Transcript
Solutions to Cache Valley PM2.5 Pollution Jay T. Price Master of Science Candidate, Bioregional Planning Environment and Society Department College of Natural Resources Utah State University 8/3/2010 Jay Price 8/3/2010
Overview • Introduction • Health and Welfare Effects of PM2.5 in Cache Valley • Air Pollution Regulations • Sources of PM2.5 Pollution • Future PM2.5 Outlook in Cache Valley • Solutions to Cache Valley PM2.5 Pollution • Additional Solutions to Cache Valley PM2.5 Pollution • Conclusion Jay Price 8/3/2010
Introduction Inversions trap pollution in the valley Accumulated pollution can reach extremely high levels Agriculture still a major economic player in the valley Population projected to be 250,000 by 2040 47,000 additional dwelling units needed in valley Jay Price 8/3/2010
Introduction (Cont.) • PM2.5 levels some of highest ever seen (outside of forest fires) • Instantaneous concentration: • 2004- 182 µg/m3 (micrograms per cubic meter of air) • 24-hour average concentration: • 2002- 137.5 µg/m3 • 2004- 132.5 µg/m3 Jay Price 8/3/2010
Health and Welfare Effects of PM2.5 in Cache Valley Health Effects PM2.5 can: Penetrate deeply into the lungs Aggravate existing heart and lung diseases Alter the body’s defenses against bacteria and viruses Irritate eyes, nose, throat and lungs Kill you prematurely Most at-risk are young, elderly, and those with lung disease Jay Price 8/3/2010
Health and Welfare Effects of PM2.5 in Cache Valley Welfare Effects: • Impaired visibility and views • School children stuck in classroom—too much directed attention can reduce ability to learn and concentrate • Loss of economic activity—people leaving the valley or refusing to move there • Vegetation and buildings can be damaged • Acid rain Jay Price 8/3/2010
Air Pollution Regulations PM2.5 Regulations: 2006- EPA reviewed epidemiological science = strengthened 24-hour NAAQS for PM2.5 35 µg/m3 Estimated Costs/Benefits from new PM2.5 NAAQS (US): In 2020, costs = $5.4 billion/year In 2020, benefits = $9 - $75 billion/year 350,000 fewer missed school/work days 1,200 – 13,000 fewer premature deaths from PM2.5 pollution Jay Price 8/3/2010
Air Pollution Regulations (cont.) Cache Valley • 2004-06 average = 62.5 µg/m3 (Cache County, UT) • Designated “Non-attainment” effective 14 Dec 2009 • ~70 other counties in US • 3 years to submit SIP • Must reach attainment by 2015 • Extensions possible until 2020 • EPA projects CV will remain non-attainment for PM2.5 through 2015 and 2020 (only 27 other counties) Jay Price 8/3/2010
Sources of PM2.5 Pollution Compounds necessary for chemical reactions: NH3 (Ammonia) O3 (Ground-level ozone) Precursor Emissions of PM2.5 include: NOX (Oxides of Nitrogen) SOX (Oxides of Sulfur) VOCs (Volatile Organic Compounds) CO (Carbon Monoxide) Most NOX is emitted as NO, which is relatively innocuous Without O3 to oxidize NO, the chemical reaction forming PM2.5 may not happen O3 is itself a secondary pollutant (VOCs and/or CO, NOX, and sunlight). More research needed on importance of CO in valley’s PM2.5 problem. CO emissions > all other precursor emissions in CV combined Jay Price 8/3/2010
Sources of PM2.5 Pollution (Cont.)Table 1: Cache County 2008 Emissions (tons) (From UDAQ 2010) http://www.airquality.utah.gov/Planning/Emission-Inventory/index.htm Jay Price 8/3/2010
Sources of PM2.5 Pollution (Cont.) • Difficult to define any definite trends • Possible trends: • Decreases in SOX (esp. from on-road mobile sources) • Decreases in NOX (esp. from on-road mobile sources) • Increases in CO (esp. from on-road mobile sources) • Little change in VOCs overall Jay Price 8/3/2010
Sources of PM2.5 Pollution (Cont.) Table 2: Breakdown of Area Sources 2008 (From Nielsen 2010) Jay Price 8/3/2010
Sources of PM2.5 Pollution (Cont.) • Inversions create colder temperatures in the valley, increasing the need to burn more wood to heat homes • Wood burning has been shown to represent over 50% of primary PM2.5 emissions in other areas during the winter • Wood burning in Cache Valley likely represents the single largest source of direct PM2.5 emissions during winter inversions Jay Price 8/3/2010
Future PM2.5 Outlook in Cache Valley Housing in Cache Valley Cache Valley home furnaces in 2000 represented about 3.8% of all 2008 NOX emissions, or 116 tons per year In 2040, (~250,000 people , ~47,000 new housing units) ~317 tons of NOX, or 10% of 2008 NOX levels Efficiency gains in furnaces could be offset by larger homes Housing will be an ever-growing piece of NOX pie in future Jay Price 8/3/2010
Future PM2.5 Outlook in Cache Valley (Cont.) Vehicles • In 2005, ~80,000 vehicles in the valley (0.74 vehicles per person) • By 2040, ~185,000 vehicles (w/ same ratio) • VMTs growing faster than population in the valley • Logan Urbanized Area (LUA) has Travel Time Index (TTI) (congestion index) of 1.12 in 2002 • TTI for LUA projected to be 1.34 in 2030 with no road expansion/construction • 1.18 with all the proposed road expansions Maybe… • A UC-Berkeley study showed that with every 10% increase in road capacity (within 4 years) = 9% increase in traffic Jay Price 8/3/2010
Future PM2.5 Outlook in Cache Valley (Cont.) Table 3: PM2.5 Readings for Cache Valley (Logan, UT) 2000-2009. (From UDAQ 2010) Jay Price 8/3/2010
Solutions to Cache Valley PM2.5 Pollution (Cont.) • The # of inversion days unchanged since ‘80s • The table shows no consistency or real patterns in PM2.5 values in Cache Valley over the last 10 years • PM2.5 poses as great a risk now as it did in 2002 or 2004 Jay Price 8/3/2010
Solutions to Cache Valley PM2.5 Pollution More people and more cars driven more miles = more pollution Valley is already in non-attainment How can the valley grow the way it has AND reach attainment? Something has to change Jay Price 8/3/2010
Solutions to Cache Valley PM2.5 Pollution (Cont.)Reducing Pollution from Homes • Orientation: low on south-facing slopes to maximize solar radiation, minimize wind, and avoid pooling of cold air at bottom of slope • Urban Heat Island- cluster homes in cities to increase solar radiation • Geothermal Heat • Insulation, sealing leaks, efficient furnaces = 20-50% reduction Figure 1: Clarkston, UT, taken by JordyGuth in Toth et al. 2006 Jay Price 8/3/2010
Solutions to Cache Valley PM2.5 Pollution (Cont.)Reducing Pollution from Homes Woodstoves and Fireplaces • ~6% of Cache County, UT homes use them as primary heat source; ~11% as secondary source • ~6543 units valley-wide • EPA estimates 75% of woodstoves in use in US are inefficient and should be replaced or eliminated • New stove can reduce PM by 70% • ~4900 units would need to be replaced or eliminated in Cache Valley • Public Education • Burn restrictions- only in EPA approved, or NONE Jay Price 8/3/2010
Solutions to Cache Valley PM2.5 Pollution (Cont.) Land Use Planning: • 3 recent major land use studies: • Sustainable Design Assessment Team (SDAT)—2005 • USU Bioregional Planning Studio—2005-06 • Envision Cache Valley—2010 • The last 2 include very similar alternative future scenarios • All of them include air quality as a major issue, but none of them focused solely on it Jay Price 8/3/2010
Solutions to Cache Valley PM2.5 Pollution (Cont.) Envision Cache Valley: • 4 of 9 guiding principles of the “Vision” have direct application to air quality, but the Vision itself does not do enough to reduce air pollution: • 1. …individual community identity… inward growth… compact development • 2. …mixed-use neighborhoods and town centers • 3. …sustainable industry and good-paying jobs close to home. • 4. …balanced transportation network …improved roadway connections …enhanced public transportation options…streets that encourage bicyclist and pedestrian mobility. Jay Price 8/3/2010
Solutions to Cache Valley PM2.5 Pollution (Cont.) Urban Growth Boundaries to Enhance Infill, Redevelopment, and Community Identity • “Vision” scenario suggests 6% of new growth through 2040 come from infill and redevelopment • 2 other scenarios include higher levels of infill/redevelopment- 7% and 11% respectively- 60% of the valley supporting latter I recommend: • 11% infill/redevelopment a starting point • Infill/redevelopment can reduce VMTs between 13%-72% compared to greenfield development, AND cost municipalities less Jay Price 8/3/2010
Solutions to Cache Valley PM2.5 Pollution (Cont.) Urban Growth Boundaries to Enhance Infill, Redevelopment, and Community Identity (cont.) • Recent trends= 1.4 du/acre; Vision= 1.7 du/acre • According to models run by CMPO, = 2% decrease in VMTs in 2040 compared to status quo • One alternative density = 3.3 du/acre, 12.7% decrease in VMTs in 2040 • A meta-analysis of studies showed that when density, diversity of uses, accessible destinations, and interconnected streets double, VMTs are reduced by 33% I recommend: • 3.3 du/acre as bare minimum. More density etc. is needed for greater VMT reductions in Cache Valley Jay Price 8/3/2010
Solutions to Cache Valley PM2.5 Pollution (Cont.) Urban Growth Boundaries to Enhance Infill, Redevelopment, and Community Identity (cont.) Personal Example: • My 1300 ft2 home on 1/10th acre, 2 neighboring houses have the same sized lot with 2 dwelling units each (= 20 du/acre) • Bike/bus/walk to work ~3 mi. • Most growth in Cache Valley is internal; many young families need smaller lots, closer to where they work/attend school • Owning and operating a car ~$6000 per year, ~$60,000 in home purchasing power on a mortgage ($500/month) Jay Price 8/3/2010
Solutions to Cache Valley PM2.5 Pollution (Cont.) Urban Growth Boundaries to Enhance Infill, Redevelopment, and Community Identity (cont.) • Individual community identity IF development encourages alternatives to cars • ECV does not specifically encourage urban growth boundaries • But, I do • Urban growth boundaries: • By restricting or making development outside the boundaries prohibitively expensive, communities will seek infill/redevelopment AND maintain their individual identity • Result: VMTs will be reduced tremendously Jay Price 8/3/2010
Solutions to Cache Valley PM2.5 Pollution (Cont.)Transportation: Space for All Forms • ECV includes 3 elements: • A balanced transportation network • Road connectivity • Enhancing public transportation options • Bus Rapid Transit (BRT) system: Hyrum-Smithfield, USU-Transit Ctr • Express bus to Preston; to Wellsville or even Brigham City • Peak-time bus loops to smaller communities • ECV espouses a transportation master plan to incorporate all 3 elements Jay Price 8/3/2010
Solutions to Cache Valley PM2.5 Pollution (Cont.)Transportation: Space for All Forms (Cont.) • CMPO already has transportation master plan but: • ECV suggests it expand to include all areas of valley • I recommend the master plan: • Focus less on new roads/expanding existing roads • Focus more on bicycle and pedestrian amenities and on securing funding for those (most bike improvements “unfunded” ) • Focus more on road connectivity • Focus more on providing specific examples of how to improve public transportation Jay Price 8/3/2010
Solutions to Cache Valley PM2.5 Pollution (Cont.)Transportation: Space for All Forms (Cont.) Public Transportation Transformation in Cache Valley: Table 4: Trip Modal Share in Cache Valley (From Gilbert 2010) Jay Price 8/3/2010
Solutions to Cache Valley PM2.5 Pollution (Cont.)Transportation: Space for All Forms (Cont.) Public Transportation Transformation in Cache Valley (cont.): • For a transformation, I recommend at least 2 phases: • Phase I- BRT and BRT Feeders (CVTD 1-11 continued with focus on BRT connection) (CVTD North/South discontinued) • Phase II- Connecting Smaller Communities Jay Price 8/3/2010
Solutions to Cache Valley PM2.5 Pollution (Cont.)Transportation: Space for All Forms (Cont.) Public Transportation Transformation in Cache Valley (cont.): • Phase I • CRMT (Cache Rapid Metro Transit) pronounced “Kermit”: • 15-minute frequency • Standard conventional buses (but green) • Mixed Flow with TSP/AVL OR Queue Jumpers at critical intersections • No guidance for vehicles • Bus-Only lanes at peak times with signage and striping • APC/AVL for planning routes/stops effectively • Start in spring with no shelters, then add simple shelters at high-volume stops by winter (or all stops as winter is when ridership helps the most) • Standard curb height at stops, spaced >1/2 mi apart • Bus pull-outs for heavy traffic areas to minimize interfering with other vehicles • Hybrid-electric ULSD • No Fares • Existing parking lots as park and ride access Jay Price 8/3/2010
Solutions to Cache Valley PM2.5 Pollution (Cont.)Transportation: Space for All Forms (Cont.) Public Transportation Transformation in Cache Valley (cont.): • Phase I (cont.) • CRMT Stops: (16 stops with endpoints in Smithfield and Hyrum on 14.2 mi route) • End Point at E. Main and 800 E. intersection in Hyrum • 3200 South in Nibley • E. Mill Road in Millville, • 2600 S. in Nibley • 2300 S. • 1700 S. • 1200 S. • 700 S. • 300 S. • Main Street • The Transit Center on 500 N. • 1400 N. • 1800 N. • 2500 N. • West Center Street of Hyde Park • 600 S. in Smithfield • 300 S. in Smithfield • End Point at 200 N. in Smithfield Jay Price 8/3/2010
Solutions to Cache Valley PM2.5 Pollution (Cont.)Transportation: Space for All Forms (Cont.) Public Transportation Transformation in Cache Valley (cont.): • Phase I (cont.) SPex (Smithfield-Preston Express): • SPex buses are distinct from CRMT, possibly smaller, but coordinated with CRMT for transfers • SPex Stops: (5 stops along 19.6 mi route) • End Point at 100 N. in Smithfield • Richmond • Cove • Hwy 61/91 intersection • Franklin • End Point at Hwy 36/91 intersection in Preston Jay Price 8/3/2010
Solutions to Cache Valley PM2.5 Pollution (Cont.)Transportation: Space for All Forms (Cont.) Public Transportation Transformation in Cache Valley (cont.): • Phase I (cont.) CRMT Feeders: • FLYs (Fast Little Yellow) buses: • Small yellow buses (15-passengers) or vans • Mostly fixed routes, but some flexibility • Travel around small cities collecting passengers • Can stop between cities as needed • Connect with CRMT or SPex as end point in every case • Can call ahead for closer to home service if within the service area Jay Price 8/3/2010
Solutions to Cache Valley PM2.5 Pollution (Cont.)Transportation: Space for All Forms (Cont.) Public Transportation Transformation in Cache Valley (cont.): • Phase I (cont.) • FLY Routes: (back and forth NOT circular loops) • Dayton – Preston • Weston – Cornish – Lewiston – Hwy61/91 • Clarkston – Trenton – Richmond • Newton – Smithfield (possibly to Amalga on call-in) • Mendon – Hwy 30 – Transit Center in Logan • Wellsville – Hyrum • Around Smithfield – CRMT/SPex • Around Hyde Park and North Logan – CRMT • River Heights – Providence – Millville – CRMT Jay Price 8/3/2010
Solutions to Cache Valley PM2.5 Pollution (Cont.)Transportation: Space for All Forms (Cont.) Public Transportation Transformation in Cache Valley (cont.): • Phase II: (Connecting Smaller Communities) • FLY Routes: (back and forth NOT circular loops) • Weston – Dayton • Clifton – Dayton • Cornish – Trenton – Clarkston – Newton • Newton – Cache Junction – Peter – Mendon – Wellsville • Benson – Airport – 2500 N. (CRMT stop) • Paradise - Hyrum Jay Price 8/3/2010
Solutions to Cache Valley PM2.5 Pollution (Cont.)Transportation: Space for All Forms (Cont.) Public Transportation Transformation in Cache Valley (cont.): • Phase II (cont.) • CRMT • 10-minute frequency • Articulated buses • At-grade transitways in center of road with TSP/AVL and curb guidance • Where transitways don’t extend, use Bus-Only lanes at all times with signage and striping • Keep APC/AVL for planning routes/stops effectively • Enhanced shelters with lighting, benches, trash/recycling and route info at all stops • Major stops and or end points have station enclosures or buildings • Angled curbs at height of bus platform for faster/safer boarding • No bus pull-outs needed in transitways, but still used where transitways don’t exist • Fuel-cell or all-electric • No Fares, OR conduct in-depth study to determine best method • Bike lanes, pedestrian bridges, and ramps to improve access to stations Jay Price 8/3/2010
Solutions to Cache Valley PM2.5 Pollution (Cont.)Transportation: Space for All Forms (Cont.) Public Transportation Transformation in Cache Valley (cont.): • Phase II (cont.) • Close gaps between CVTD routes by restructuring (reversing routes or re-timing for easier transfers from one route to another) • Examples: • Routes 8 & 9 at 600 W. • Routes 6 & 8 • Routes 2 & 5 • Routes 1 & 5 Jay Price 8/3/2010
Solutions to Cache Valley PM2.5 Pollution (Cont.)Transportation: Space for All Forms (Cont.) Public Transportation Transformation in Cache Valley (cont.): • Phase II (cont.): • Hopper Routes- Use FLYs to connect major activity centers currently not connected by other transit routes • 400 East in Logan from LDS Temple to Hospital to Specialty Hospital • 1000 North in Logan from Gossner’s to Football/Basketball stadiums to USU dorms and main campus • USU to Mall to Walmart • USU to downtown Jay Price 8/3/2010
Additional Solutions to Cache Valley PM2.5 Pollution Multiple solutions required- not one answer fits all Land use planning is a start Additional solutions: Restrictions Incentives Technologies Jay Price 8/3/2010
Additional Solutions to Cache Valley PM2.5 Pollution (cont.) • Restrictions: • Close schools, state offices, drive-through windows • Woodstoves/fireplaces replaced or destroyed • Burn restrictions even with new woodstoves- minimum of no visible emissions, up to no burning at all • Vehicle bans- odd/even days (Beijing 2008 63% emissions reduction) • Vehicle emissions testing every other year after certain age • In 2006, 10.3% of vehicles would fail VOC test = 47.8% of on-road mobile emissions • In 2006, 4.5% of vehicles would fail NOX test = 25.4% of on-road mobile emissions • Couple testing with Cash For Clunkers (purchase of low-emission vehicles only) • No idling for Trucks/Buses • Auxiliary Power Units (APUs) can run climate control, TV, fridge etc. without engine • Minimum insulation requirements for homes (reduce furnace use) • Furnace emissions limits – replace like woodstoves • Freshman vehicle restrictions at USU, high school vehicle restrictions Jay Price 8/3/2010
Additional Solutions to Cache Valley PM2.5 Pollution (cont.) • Incentives and Rebates: Most restrictions can be coupled with incentives: • Fee/tuition reduction for freshman not bringing cars • Grants for geothermal heating, insulation, weatherization • Carpooling gets preferential or free parking • Alternative Transportation Programs (i.e. SmartTrips in Knoxville, TN) to provide support and gift certificates for alternative commutes Jay Price 8/3/2010
Additional Solutions to Cache Valley PM2.5 Pollution (cont.) • Technological Solutions: • Alternative Vehicles • Fuel Cells- • National Academies study projected: Vehicles with internal combustion engines will completely disappear by 2050, replaced by fuel cells • Hybrid-electric vehicles required for fleets • Plug-in hybrids, available MY 2011 from VW, Toyota, Ford • All-electric vehicles (NEVs, full-speed, electric buses) • Electric Bicycles Jay Price 8/3/2010
Additional Solutions to Cache Valley PM2.5 Pollution (cont.) • Technological Solutions (cont.): • Fuel composition: • Oxygenated fuels (reduce CO & VOC emissions, but above certain level, increases NOX) • Reducing sulfur content (reduce CO, VOC, NOX, and PM)- also allows for catalytic conversion of diesel exhaust • By 2030 current heavy-duty vehicle fleet replaced, emissions reductions = removing 90%of those vehicles from road • Biodiesel • CNG • Propane Each fuel has to be examined for its effects on emissions Jay Price 8/3/2010
Additional Solutions to Cache Valley PM2.5 Pollution (cont.) • Technological Solutions (cont.): • Vapor-lock rubber attachments at refueling stations • Vapor recovery devices/techniques for underground tanks • EPA “Energy Star” rating for vehicles (compare passenger/cargo space- allows access to rebates) Jay Price 8/3/2010
Conclusion Cache Valley is in non-attainment for PM2.5 PM2.5 is very harmful to health and welfare of residents By 2040, population will more than double, bringing more pollutant sources Cache Valley cannot grow spatially in the same manner it has Solutions are needed for the problem Jay Price 8/3/2010
Conclusion (cont.) • Solutions to PM2.5 pollution • PM2.5 pollution is too complex for one simple solution • Cost-effective solutions more desirable • Land Use Planning does not require large capital outlays, but requires political will and public buy-in Solutions must address two major pollutant sources: • Homes • Vehicles Jay Price 8/3/2010
Conclusion (cont.) • Solutions to pollution from homes • Orientation • Insulation • Geothermal heating • Replacing woodstoves • Efficient furnaces or electric heaters Jay Price 8/3/2010
Conclusion (cont.) • Solutions to pollution from vehicles: • Infill/redevelopment and maintaining individual community identity • Mixed-use communities • Working close to home • Space for all forms of transportation • Walk/Bike-able communities • CRMT, SPex, FLYs, and Hoppers • Restrictions/Incentives/Technological solutions - The PM2.5 Problem will not solve itself • Multiple solutions are required • Solving the problem is possible with land use planning, restrictions, incentives, and technology Jay Price 8/3/2010
Questions ? Jay Price 8/3/2010