Lectu r e 3 : Flood Routing
Lectu r e 3 : Flood Routing CEM 0 01 H y dra u l i c S t ructu r es, C o a s t a l a n d River Engineer i ng. Dr Md R o w shon Kamal. r o w shon@legendag r oup.ed u .my. H / P: 0126627589. 1 S c hool of Com p u t ing, Information T ec hnology & Engin ee ring.

Lectu r e 3 : Flood Routing
E N D
Presentation Transcript
Lecture 3:Flood Routing CEM001HydraulicStructures,CoastalandRiverEngineering DrMd RowshonKamal rowshon@legendagroup.edu.my H/P:0126627589 1 School ofComputing,InformationTechnology& Engineering School ofCivilEngineering/Linton
HydrologicRouting:Application Analysetheeffectsofconduitmodifications • • • • • • • • Stormwaterdetention Floodmitigation Reservoirstorage Spillwaysizing Pumpingstations pond storage Changesinlanduse and Overtoppingofhighwayembankments 2 School ofComputing,InformationTechnology& Engineering School ofCivilEngineering/Linton
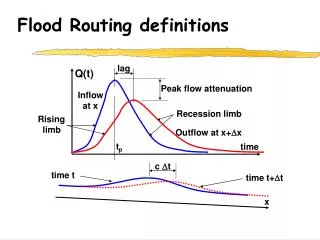
HydrologicalFlood Routing Themovementoffloodwavedowntoachannel orthroughareservoirandassociatedchangein timingorattenuation ofthewaveconstitutean importanttopicin floodplainhydrology. Itisessentialtounderstand thetheoreticaland practicalaspects offloodroutingtopredictthe temporal andspatialvariationsofafloodwave throughariverreachand/orreservoir. Floodroutingisalsousedtopredicttheoutflow • • • hydrograph from a watershed subjected to a knownamountofrainfall. 3 School ofComputing,InformationTechnology& Engineering School ofCivilEngineering/Linton
Routing Simulatethemovementofwaterthroughphysical componentsofwatershed(e.g.,channels) • • Commonly used to predict the magnitudes, volumes, and temporal patterns of flow (often a floodwave)asit moves downachannel • Physical/Hydraulic: momentum Conservation of mass and • Conceptual/Hydrologic: (continuity),butinexact Some representations physics 4 School ofComputing,InformationTechnology& Engineering School ofCivilEngineering/Linton
RoutingandTypes Routing is the process of predicting temporal and spatial variation of a flood wave as it or travels through a river (or channel reach reservoir. Twotypesofroutingcanbeperformed: •HydraulicRouting •HydrologicRouting 5 School ofComputing,InformationTechnology& Engineering School ofCivilEngineering/Linton
HydraulicRouting Hydraulicroutingmethod combinesthe continuity equation with a morerealisticrelationshipdescribing the actualphysicsof the movementof the water The equation usedresultsfrom conservationof momentum,assuming • • – – – In uniformvelocitydistribution(depth averaged) hydrostaticpressure smallbottom slope • hydraulic routing analysis, itis intended that the dynamicsofthewater accuratelydescribed orfloodwavemovementbemore 6 School ofComputing,InformationTechnology& Engineering School ofCivilEngineering/Linton
Useof Manning Equation • Stage isalsorelated to the outflowvia a relationship such as Manning's equation Q1.49AR2 S1 3 2 h f n 7 School ofComputing,InformationTechnology& Engineering School ofCivilEngineering/Linton
Hydrologic Routing Hydrologicrouting techniquesinvolvethe balancing of of inflow, outflow andvolume of storage through use the continuity equation. Application: Floodpredictions Evaluationofflood controlmeasures Assessmentofeffectsofurbanization Floodwarning Reservoirdesignand operation Spillway designfordams 8 School ofComputing,InformationTechnology& Engineering School ofCivilEngineering/Linton
Bukit MerahReservoir,Malaysia 9 School ofComputing,InformationTechnology& Engineering School ofCivilEngineering/Linton
Lake Livingston, USA 10 School ofComputing,InformationTechnology& Engineering School ofCivilEngineering/Linton
Lake Conroe,USA 11 School ofComputing,InformationTechnology& Engineering School ofCivilEngineering/Linton
Detention Ponds Detentionponds store and treat urbanrunoff andalso provide floodcontrol for the overalldevelopment. Pondsconstructedas amenitiesfor thegolfcourse and other community centers that were built up aroundthem. School ofCivilEngineering/Linton 12 School ofComputing,InformationTechnology& Engineering
DetentionPond,AUSTIN,TX 13 School ofComputing,InformationTechnology& Engineering School ofCivilEngineering/Linton
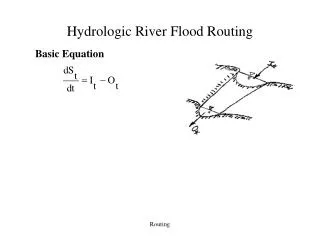
Hydrologic Routing IOS Continuity Where Equation: t I =Inflow O=Outflow S/t=Rate ofchange ofstorage Problem: You You Need: haveahydrographatonelocation(I) haverivercharacteristics(S=f(I,O)) Ahydrographatdifferentlocation(O) 14 School ofComputing,InformationTechnology& Engineering School ofCivilEngineering/Linton
Hydrologic Routing HydrographatpointA HydrographatpointB The hydrograph at B is attenuated due to storagecharacteristicsofthestreamreach. Assumption:noseepage,leakage,evaporation, orinflowfromthesides. 15 School ofComputing,InformationTechnology& Engineering School ofCivilEngineering/Linton
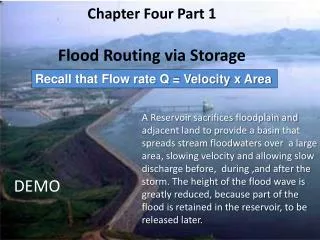
River Reach Comparisons: River vs. Reservoir Routing Level pool reservoir 16 School ofComputing,InformationTechnology& Engineering School ofCivilEngineering/Linton
HydrologicalRouting Combinethecontinuityequationwithsome • relationship betweenstorage, outflow, and possiblyinflow • These relationships are usually nature assumed, empirical,oranalyticalin Anofexampleofsucha • relationship might be a stage-dischargerelationship 17 School ofComputing,InformationTechnology& Engineering School ofCivilEngineering/Linton
Inflow Characteristics 18 School ofComputing,InformationTechnology& Engineering School ofCivilEngineering/Linton
Inflow-Storage-Outflow Characteristics 19 School ofComputing,InformationTechnology& Engineering School ofCivilEngineering/Linton
Inflow-Storage-Outflow Characteristics 20 School ofComputing,InformationTechnology& Engineering School ofCivilEngineering/Linton
Inflow-Outflow Characteristics 21 School ofComputing,InformationTechnology& Engineering School ofCivilEngineering/Linton
Storage-Water Level Characteristics 22 School ofComputing,InformationTechnology& Engineering School ofCivilEngineering/Linton
Outflow Determination 23 School ofComputing,InformationTechnology& Engineering School ofCivilEngineering/Linton
HydrologicalRouting RiverorChannelRouting –Muskingummethod –Muskingum-CungeMethod ReservoirRouting • • – Inflow-Storage-DischargeCurve (Puls Method) Storage-IndicationMethod (ModifiedPuls Method) Method – 24 School ofComputing,InformationTechnology& Engineering School ofCivilEngineering/Linton
Reservoir Routing 25 School ofComputing,InformationTechnology& Engineering School ofCivilEngineering/Linton
RequiredInformation • • • Inflowhydrograph Outflowhydrograph Surcharge Storage vs Water Level graph 26 School ofComputing,InformationTechnology& Engineering School ofCivilEngineering/Linton
Inflow-Storage-Discharge(ISD) Step1:Atfirst,asuitabletimeintervaltischosenanda betweenelevationasOrdinateand[2S/t Thetimeintervalisusuallytakenas0.20 timeoftheriseoftheinflowhydrograph. curveisprepared +O]asabscissa. to0.40timesthe From the same plot, a curve between outflow rates and elevationcanbedrawn. Step2:Atthestartoftherouting,thetermsontheL.H.S. Eq.(3)areknownand[2S2/t+O2]iscomputed. of of[2S2/t+O2]computedinStep Step3:Forthevalue 2, vs [2S/t the value ofelevation isdeterminedfrom + O] ElevationcurveandO2 fromOutflowvsElevationcurve. 27 School ofComputing,InformationTechnology& Engineering School ofCivilEngineering/Linton
28 School ofComputing,InformationTechnology& Engineering School ofCivilEngineering/Linton
Inflow-Storage-Discharge(ISD) Step 4:Step3:Forthevalueof[2S2/t+O2]computedin Step2,thevalueofelevation isdeterminedfrom[2S/t+ O] vs Elevationcurveand O2fromOutflow vs Elevationcurve. Step 5:Thenthevalue of[2S2/t+ O2] bydeducting2O2is determinedfrom [2S2/t +O2] (I2 + I3) + [2S2/t- O2] = [2S3/t +O3] Step6:Theaboveproceduresarerepeated inflowhydrographisrouted. tilltheentire Step7:Finally,themaximumwaterleveland outflowratearedetermined.Alsotheoutflow drawn. themaximum hydrographis 29 School ofComputing,InformationTechnology& Engineering School ofCivilEngineering/Linton
Modified Puls • The Modified Puls routing method is most oftenappliedtoreservoirrouting –storagerelatedtooutflow • The method may also be applied to river routingforcertainchannelsituations TheModifiedPulsmethodisalsoreferredto astheStorage-Indicationmethod • • As a hydrologic method, the Modified Puls the equation is described by considering discrete continuityequation... 30 School ofComputing,InformationTechnology& Engineering School ofCivilEngineering/Linton
Storage Indication orModified Method Puls Sn In Qn Sn1 In1 Qn1 t 2 2 Re-writing (substitutingO forQto followconvention) 2Sn 2Sn1 I O I On1 n1 n n t t The solution to the Modified Puls method is accomplishedbydevelopingagraph(ortable)ofOvs [2S/Δt + O]. In order to do this, a stage-discharge- storagerelationshipmustbeknown (outlet works). (rules)orderived 31 School ofComputing,InformationTechnology& Engineering School ofCivilEngineering/Linton
Modified PulsExample and 2S/t Given curve, the following inflow hydrograph + O find the outflow hydrograph for the reservoir assuming storm. it to be completely full at the beginning of the HydrographForModifiedPulsExample 180 150 120 90 60 30 0 0 2 4 6 8 10 Time(hr) Discharge(cfs) 32 School ofComputing,InformationTechnology& Engineering School ofCivilEngineering/Linton
Storage Indication or Modified Puls Method t altischosenanda abletimeinter v Step1:Atfirst,asui curve is prepared between Elevation as Ordinate and [2S/t+O]asAbscissa.Thetimeintervalisusually taken as 0.20to 0.40timesthetime oftheriseoftheinflow hydrograph.Fromthesameplot,acurvebetweenoutflow rates and elevationcan be drawn. Step2:Atthestartoftherouting,thetermsontheL.H.S. ofEq.(3)are knownand[2S2/t+ O2]iscomputed. Step3:Forthevalueof[2S2/t+O2]iscomputedinStep 2,thevalueofElevationisdeterminedfrom[2S/t+O] vs Elevation curve and O2 from Outflow vs Elevation curve. 33 School ofComputing,InformationTechnology& Engineering School ofCivilEngineering/Linton
ModifiedPuls Method Step4:Thenthevalueof[2S2/t+O2]bydeducting2O2 is determined from[2S2/t- O2] Step5:Then,thevalueof[2S3/t+O3]iscomputedfrom the valuesof[2S2/t- O2]and (I2+ (I2+ I3)+[2S2/t- O2]=[2S3/t+ I3),thus O3] Step6:Theaboveproceduresare inflowhydrographis routed. repeated tilltheentire Step 7: Finally, the maximum water level and the maximumoutflowratearedetermined.Alsotheoutflow hydrographisdrawn. 34 School ofComputing,InformationTechnology& Engineering School ofCivilEngineering/Linton
Modified Puls Example • 2S/t+ Ocurve: 35 School ofComputing,InformationTechnology& Engineering School ofCivilEngineering/Linton
ModifiedPulsExample •Atablemay be createdasfollows: Time In In+In+1 2Sn/t-On 2Sn/t+On+1 On+1 (hr) (cfs) (cfs) (cfs) (cfs) (cfs) 0 1 2 3 4 5 6 7 8 9 10 11 12 36 School ofComputing,InformationTechnology& Engineering School ofCivilEngineering/Linton
ModifiedPulsExample •Next, usingthehydrographandinterpolation, inflow (discharge)values. insert the •For example at 1 hour, the inflow is 30 cfs. Time In In+In+1 2Sn/t- On 2Sn/t+On+1 On+1 (hr) (cfs) (cfs) (cfs) (cfs) (cfs) HydrographForModifiedPulsExample 180 150 120 90 60 30 0 0 2 4 6 8 10 Time(hr) 0 0 1 30 2 60 3 90 4 120 Discharge(cfs) 5 150 6 180 7 135 8 90 9 45 10 0 11 0 12 0 37 School ofComputing,InformationTechnology& Engineering School ofCivilEngineering/Linton
Modified Puls Example •Thenextstep isto addtheinflowtotheinflowinthe next timestep. •For thefirst blanktheinflow at0 is added to the inflow at 1 hour to obtain a value of 30. Time In In+In+1 2Sn/t- On 2Sn/t+On+1 On+1 (hr) (cfs) (cfs) (cfs) (cfs) (cfs) 0 0 30 1 30 2 60 3 90 4 120 5 150 6 180 7 135 8 90 9 45 10 0 11 0 12 0 38 School ofComputing,InformationTechnology& Engineering School ofCivilEngineering/Linton
ModifiedPulsExample •Thisis thenrepeatedfortherestof thevaluesinthecolumn. Time In In+In+1 2Sn/t-On 2Sn/t+On+1 On+1 (hr) (cfs) (cfs) (cfs) (cfs) (cfs) 0 0 30 1 30 90 2 60 150 3 90 210 4 120 270 5 150 330 6 180 315 7 135 225 8 90 135 9 45 45 10 0 0 11 0 0 12 0 0 39 School ofComputing,InformationTechnology& Engineering School ofCivilEngineering/Linton
Modified Puls Example 2Sn 2Sn1 I O I On1 n1 n n t t •The 2Sn/t+ equation: On+1 columncanthen be calculatedusingthefollowing I+I +2S1-O=2S2+O 1 2 1 2 t t Notethat2Sn/t- Onand On+1 aresettozero. Time In In+In+1 2Sn/ (hr) (cfs) (cfs) (c t-On 2Sn/t+On+1 On+1 fs) (cfs) (cfs) 0 0 30 0 0 1 30 90 30 2 60 150 3 90 210 30+ 0 =2Sn/t+ On+1 4 120 270 5 150 330 6 180 315 7 135 225 8 90 135 9 45 45 10 0 0 11 0 0 12 0 0 40 School ofComputing,InformationTechnology& Engineering School ofCivilEngineering/Linton
ModifiedPulsExample •Thenusingthecurveprovidedoutflowcan bedetermined. • Inthiscase,since2Sn/t+ provide(darnhardtosee!) On+1 =30,outflow=5 basedonthegraph Time In In+In+1 2Sn/t-On 2Sn/t+On+1 On+1 (hr) (cfs) (cfs) (cfs) (cfs) (cfs) 0 0 30 0 0 1 30 90 30 5 2 60 150 3 90 210 4 120 270 5 150 330 6 180 315 7 135 225 8 90 135 9 45 45 10 0 0 11 0 0 12 0 0 41 School ofComputing,InformationTechnology& Engineering School ofCivilEngineering/Linton
ModifiedPulsExample •To obtainthefinalcolumn,2Sn/t- On,twotimes theoutflowis subtractedfrom2Sn/t+ On+1. • Inthisexample30 - 2*5= 20 Time In In+In+1 2Sn/t-On 2Sn/t+On+1 On+1 (hr) (cfs) (cfs) (cfs) (cfs) (cfs) 0 0 30 0 0 1 30 90 20 30 5 2 60 150 3 90 210 4 120 270 5 150 330 6 180 315 7 135 225 8 90 135 9 45 45 10 0 0 11 0 0 12 0 0 42 School ofComputing,InformationTechnology& Engineering School ofCivilEngineering/Linton
Modified Puls Example 2Sn 2Sn1 I O I On1 n1 n n t t •The same stepsarerepeatedfor • First90 +20 =110. thenextline. • Fromthegraph,110equalsan • Finally110- 2*18=74 outflowvalueof18. Time In In+In+1 2Sn/t-On 2Sn/t+On+1 On+1 (hr) (cfs) (cfs) (cfs) (cfs) (cfs) 0 0 30 0 0 1 30 90 20 30 5 2 60 150 74 110 18 3 90 210 4 120 270 5 150 330 6 180 315 7 135 225 8 90 135 9 45 45 10 0 0 11 0 0 12 0 0 43 School ofComputing,InformationTechnology& Engineering School ofCivilEngineering/Linton
ModifiedPulsExample •Thisprocesscanthenbe repeatedfortherestofthecolumns. •Now alistoftheoutflowvalueshavebeen problemiscomplete. calculatedand the Time In In+In+1 2Sn/t-On 2Sn/t+On+1 On+1 (hr) (cfs) (cfs) (cfs) (cfs) (cfs) 0 0 30 0 0 1 30 90 20 30 5 2 60 150 74 110 18 3 90 210 160 224 32 4 120 270 284 370 43 5 150 330 450 554 52 6 180 315 664 780 58 7 135 225 853 979 63 8 90 135 948 1078 65 9 45 45 953 1085 65 10 0 0 870 998 64 11 0 0 746 870 62 12 0 0 630 746 58 44 School ofComputing,InformationTechnology& Engineering School ofCivilEngineering/Linton
End 45 School ofComputing,InformationTechnology& Engineering School ofCivilEngineering/Linton