
Demographic Transition Model & Population Stages
E N D
Presentation Transcript
Demographic Changes Demographic Transition Model Transitions In World Population
Calculating Population Change Four variables for population equation • Births + immigration = increase • Deaths + emigration = decrease • (CBR+I)-(CDR+E)= Total population • This equation better suited to study population trends rather than specifics • In what ways might geographers use this data?
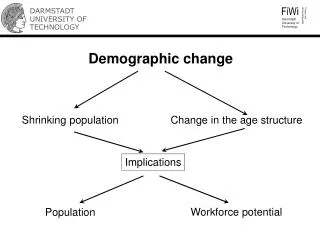
Demographic Transition Model • Used to determine stages of a country’s growth • Graphs population, time, birth and death rates (doesn’t account for migration) • Used to correlate a country’s progress in technology and society Pop Stages/Time
Stage 1: Low Growth (High Stationary) • Overall Population is sparse • High birth-high death= stationary pop • Lack of major food surplus keeps population low • Super long doubling time • ALL WORLD REGIONS UNTIL 17th C • Agricultural Revolution: domesticated plants/animals make for better food sources and lead to transition
Stage 2: High Growth (Early Expanding) • CDR decreases rapidly (especially people under the age of 5) • CBR remains steady • Results in natural increase • Industrial Revolution • Technology produces and transfers goods • Industry and farming improve • Sanitation improvements- examples? • Medical advancements- examples? • Bangladesh, Nigeria, Pakistan
Stage 3: Moderate Growth (Late Expanding) • CBR drops • CDR drops but slower than stage 2 decrease • NIR is modest • CBR drops because of new technologies • People have fewer kids • Medical advances mean less chance of children dying • Economic factors: less farming more urban • How does this correlate? • Women become better educated • How does this correlate? • China, Brazil, Mexico, India
Entering Stage Three Even though birth rate is falling, population momentum keeps the total population growing.
Stage 4: Low to No Growth (Low Stationary) • CBR=CDR (little to no growth) • Most European nations in Stage 4 • U.S. moving in this direction • Social Customs • Women working • Employed parents need to plan for day care • Entertainment and leisure activities • EXPLAIN! US, Sweden, Japan, Britain
Stage 1 Stage 2 Stage 3 Stage 4 Birth Rate Death Rate Total Population Low growthincr grwthdecr grwthlow/no
Problems with the Model? • No "guidelines" for how long it takes a to get from Stage I to IV. Just describes it • Western Euro countries took centuries • Economic Tigers took decades. • Nations that were populated by emigration did not go through early stage • Birth rates have fallen below death rates in some areas, should there be a stage V?
PROPOSED FIFTH STAGE: • Negative population growth • CBR drops to zero-CDR very low-population is slowly dying out (Children of Men) • Not enough people in the work force to support programs for the aged (dependency ratio very lopsided) • Social programs overloaded-unrest & probable chaos • Innovations stagnant Prezi