Download
1 / 41
410 likes | 559 Vues
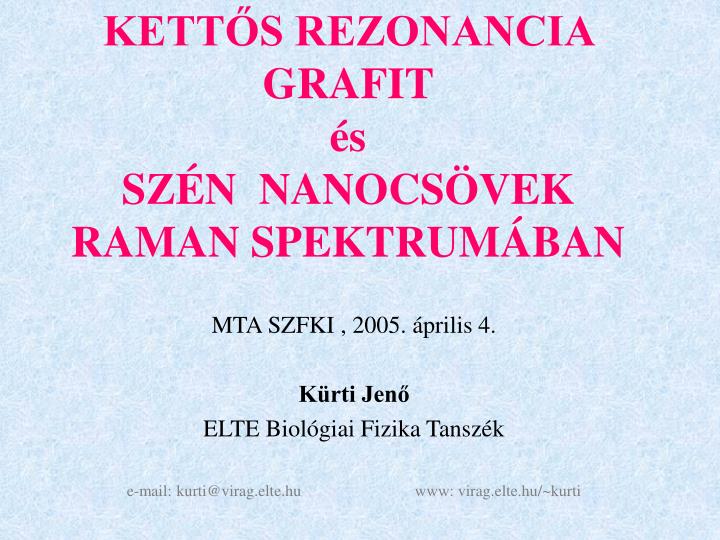
KETTŐS REZONANCIA GRAFIT és SZÉN NANOCSÖVEK RAMAN SPEKTRUMÁBAN. MTA SZFKI , 2005. április 4. Kürti Jenő ELTE Biológiai Fizika Tanszék e-mail: kurti@virag.elte.hu www: virag.elte.hu/~kurti. VÁZLAT. Bevezetés

E N D
KETTŐS REZONANCIA GRAFIT ésSZÉN NANOCSÖVEK RAMAN SPEKTRUMÁBAN MTA SZFKI , 2005. április 4. Kürti Jenő ELTE Biológiai Fizika Tanszék e-mail: kurti@virag.elte.hu www: virag.elte.hu/~kurti
VÁZLAT • Bevezetés • rendezetlenség („disorder”) által indukált sáv (D-sáv) sp2 szén vegyületek Raman spektrumában • Kettős rezonancia (elmélet) • grafit • egyfalú szén nanocsövek (SWCNTs) • Összefoglalás
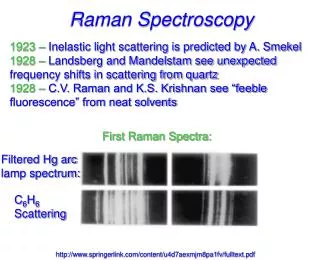
D band in graphite G D λ = 488 nm • graphite single crystal • stress-annealed pyrolite graphite • commercial graphite • activated charcoal G: 1575 cm-1 D: 1355 cm-1 F.Tuinstra and J.L.Koenig, J. of Chem. Phys. 53, 1126 (1970)
A grafit D-sávjának diszperziója Elaser függvényében ωD /Elaser 50 cm-1/eV I. Pócsik, M. Hundhausen, M. Koós and L. Ley, J. of Non-Crystalline Solids 227-230B, 1083 (1998)
Measured D band of SWCNTs Bundles with Gaussian diameter distribution: p(d) exp(-(d-d0)2/22) with d0 = 1.32 nm and = 0.14 nm various laser excitation (eV) J.Kürti, V.Zólyomi, A.Grüneis and H.Kuzmany, PRB 65, 165433, 2002
Measured anomalous dispersion of the D band of SWCNTs ωD*(cm-1) = 2419 + 106 Elaser (eV) (G’) ωD(cm-1) = 1219 + 52 Elaser (eV)
Tight bindingR.A.Jishi et al. CPL 209 77 (1983)DFTD.Sanchez-Portal et al. PRB 59 12678 (1999) Valence force field MO/8 C.Mapelli et al. PRB 60 12710 (1999) DFT (VASP) G.Kresse et al. Europhys. Lett. 32 729 (1995)
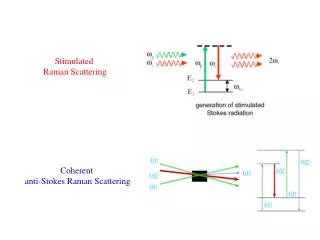
Raman basics Stokes, n0 = w2 – w1, n = w : a w1 b w w1 w2 i
Raman basics Stokes, n= w1 – w2, n = w : b a 0 w, 0 w, w, w1 w w1 w2
Disorder induced resonant Raman scattering defect scattering phonon scattering
Raman amplitudes for the Feynman diagrams Stokes ( = 0.01-0.1 eV) anti Stokes Eael = conduction(k) - valence(k) Ebel = conduction(k’) - valence(k) Double resonance: two of the denominators are zero at the same time (C.Thomsen and S.Reich, PRL 85, 5214, 2000 : for graphite)
Disorder induced resonant Raman scattering defect scattering phonon scattering
DEG 18 eV DEM 6 eV DEK 0 eV conduction band valence band Graphene electron energy dispersion from book: R.Saito, G.Dresselhaus, M.S.Dresselhaus, Physical Proprties of Carbon Nanotubes, Imperial College Press, 1998
Relevant 4th order Feynman diagrams for Stokes and antiStokes processes defect scattering phonon scattering
Raman amplitudes for the Feynman diagrams Stokes ( = 0.01-0.1 eV) anti Stokes Eael = conduction(k) - valence(k), Ebel = conduction(k’) - valence(k), etc Double resonance: two of the denominators are zero at the same time (C.Thomsen and S.Reich, PRL 85, 5214, 2000 : for graphite)
DEG 18 eV DEM 6 eV DEK 0 eV conduction band valence band conduction band valence band I, II III, IV Graphene electron energy dispersion from book: R.Saito, G.Dresselhaus, M.S.Dresselhaus, Physical Proprties of Carbon Nanotubes, Imperial College Press, 1998
equi excitation energy curves of electrons electron dispersion phonon dispersion equi phonon frequency curves q0 q0 q0 = K’K K’
Calculated D band of graphene Elaser = 2.0 eV — Elaser = 2.5 eV ---
Simple qualitative interpretation of the maxima 1, 2 and 3 q1 > q0 q2 < q0 q3a = q3b q0 q0 = |K’K|
Points in k-space of a general (chiral) SWCNT for double resonance condition qphonon 2/d
Triple (quadruple) resonance = double resonance + VH enhancement Van Hove singularity Van Hove singularity Eii 1D - DOS
Calculated van Hove enhancement for the (11,9) tube in out E22 = 1.197 eV E33 = 2.382 eV E44 = 2.860 eV
Abnormal anti-Stokes Raman scattering for the D mode of SWCNTs Elaser = 2.41eV S.L.Zhang et al., PRB 66, 35413, 2002
Calculated dispersion of the Stokes and anti-Stokes D band for a bundle of SWCNTs ω ωD /Elaser• hωphonon a-S 0.16 eV 0.16 eV S V.Zólyomi and J. Kürti, PRB 66, 073418, 2002
SUMMARY • The D band (around 1300 cm-1) of sp2 carbon materials (graphite as well as SWCNTs) is induced by disorder. Defects allow higher order Raman process involving non-zone-center phonons • The D* (G’) band (around 2600 cm-1) is te result of a two-phonon process, and needs no disorder • The position of the D band shifts with increasing laser excitation energy ( 50 cm-1/eV). Similar dispersion holds for the D* (G’) band ( 100 cm-1/eV) • Additional (selective) enhancement due to Van Hove singularities in the case of SWCNTs
A. C. Dillon et al., CPL 401 (2005) 522 Microscopy and ab initio… Characterization of “Defects” R. Czerw et al. Nanoletters 1, 457 (2001) M. Terrones et al. Appl. Phys. A, 74, 355 (2002) from Ado Jorio
M. Terrones et al. Materials Today Magazine (2004) A. C. Dillon et al. CPL 401, 522 (2005) Mass-transport-limited oxidation inducing defects The D band intensity depends on reaction time D band increases with increasing B doping from Ado Jorio
Defect-free SWNT bundles Defect-free sample Defective sample Forbidden Raman modes are observed in defective materials Disorder G-band proposed by Maultzsch et al. PRB (2003) PMMA+SWNT fiber M.Souza et al. PRB (2004) from Ado Jorio
Micro-Raman spectra from graphite edges HOPG substrate Raman Spectra AFM armchair edge zigzag edge STM Cancado et al. PRL (2004) D band is strong for armchair edge and weak for zigzag edge
Micro-Raman spectra from graphite edges Double resonance one “1D defect” explains the result Cancado et al. PRL (2004) Such an effect has been predicted for SWNTs but not yet observed [Maultzsch et al., PRB(2001)] Raman can tell us if the edge has an armchair or zigzag structure