Download
1 / 30
310 likes | 488 Vues
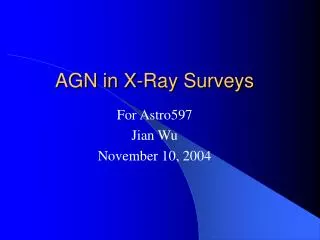
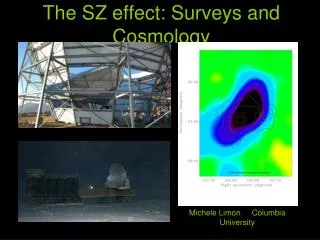
The SZ effect: Surveys and Cosmology. Michele Limon Columbia University. Structure Formation. Standard Λ CDM Model Box Size 43 Mpc 3 30 > z > 0. In typical structure formation scenarios, low mass clusters emerge in significant numbers at z~2-3.

E N D
The SZ effect: Surveys and Cosmology Michele Limon Columbia University
Structure Formation • Standard ΛCDM Model • Box Size 43 Mpc3 • 30 > z > 0 In typical structure formation scenarios, low mass clusters emerge in significant numbers at z~2-3 http://cosmicweb.uchicago.edu/filaments.html
Group/Cluster Formation • Standard ΛCDM Model • Box Size 4.3 Mpc3 • 30 > z > 0 http://cosmicweb.uchicago.edu/group.html
Galaxy Clusters Galaxies Mgal ≈ 0.02 Mtot Early types Ngal ≈ 10 – 1000 Poor groups – rich clusters POSS Gas Mgas ≈ 0.1 Mtot Heated by infall Tgas ≈ (1-15) keV Chandra Dark Matter Mtot ≈ 1014 – 1015Solar Masses R ≈ 1 Mpc
Why Clusters • Theory: Clusters relatively simple objects. Evolution of massive cluster abundance determined by gravity. Clusters straddle the epoch of dark energy domination 0<z<3. • Why Do We Need Yet Another Cosmological Probe? • - Degeneracies differ from CMB, SNe, Galaxies • Systematics are different • Unique exponential dependence • Modelability Adapted from Zoltan Haiman
How to find Clusters • Optical/IR imaging: Early type galaxy colors (e.g., darkCAM, DES, ISCS, LSST, Pan-starrs, RCS1&2 ,…) • Good contrast • Relation to mass • X-ray imaging: Lx from hot gas (e.g., review by Rosati et al. 2002, XCS) • Good contrast • T tightly correlated to mass • All-sky surveys - shallow • Deeper serendipitous - limited area, inhomogeneous • Weak lensing: shear/aperture mass (e.g., DUNE, JDEM) • Direct relation to mass • Projection effect • SZ Survey
Sunyaev-Zel'dovic Effect In the Rayleigh-Jeans Regime:
Thermal & Kinetic SZ Effect For Tcmb =2.726K - = 128 GHz - = 2.34 mm o = 1.38 mm o = 218 GHz + = 0.80 mm + = 370 GHz Thermal and kinetic SZ effect for a cluster with a peculiar velocity of 500 km s–1 (Carlstrom et al. 2002).
SZ Effect: why it is so nice SZ contours are 0.75 K and X-ray scales are the same. SZ and X-ray maps (insert). Mohr 2002 Z = 0.17 Z = 0.54 Z = 0.83 • 1) The very distinct spectral signature • 2) Measures the total thermal content of the cluster • 3) Temperature decrement more or less redshift independent • 4) Less susceptible to complicated cluster substructure, core • physics (proportional to density and not density squared as in Xrays)
SZ Spectral Signature M = 1015M T = 9 keV z = 0.43 M = 2×10¹⁴M T = 3 keV z = 0.43
Potential for different methods to constrain “w” Cluster Surveys are complementary to already well established cosmological probes Levine, Shultz & White 2002
Volume effect Growth Effect Sensitivity of Cluster Redshift Distribution to Dark Energy Equation of State • Increasing w keeping WEfixed has the following effects: • It decreases volume surveyed • It decreases growth rate of perturbations Fig courtesy Joe Mohr
Clusters Surveys • Interferometers: ∼10-100 sq. deg. • Arcminute MicroKelvin Imager (AMI) (in operation) first image: astro-ph/0509215 • 10 new antennas (3.7m) + Ryle Telescope (12.8m), 13.5 -- 18 GHz, • Array for Microwave Background Anisotropy (AMIBA) • 19 antennas (0.3m), 90 GHz, Mauna Loa Hawaii • SZ Array (in operation) • 8 antennas (3.5m), 30 GHz + 90GHz follow-up, OVRO + BIMA = CARMA • Bolometer arrays: ∼100-4000 sq. deg. • ACBAR: 4 band-4element array at South Pole (in operation) • BOLOCAM: 150 element array CSO Mauna Kea (in operation) • APEX: ALMA prototype, 300 element array Llano de Chajnantor (Chile) (in operation) • ACT: Atacama plateau, 3 x 1000 element array Cerro Toco (Chile) (in operation) • SPT: 10m dish, 1000 element array South Pole (in operation) • Planck: ∼40000 sq. deg. = all-sky • ∼10,000 clusters L2 launch 2008/2009
AMI Small Array Large Array
SZA http://calvin.phys.columbia.edu/group_web/sza.html http://astro.uchicago.edu/sza/
ACBAR operates on the 2m Viper Telescope Chopping tertiary mirror Skirt reflects primary spill-over to sky. Ground shield blocks emission from EL< 25º. Panel lowers for low-EL observations Large AZ chop (~3°) + small beams (~4-5) = broad -space coverage (~75 < < 3000) and sensitivity to clusters over a wide redshift range http://cosmology.berkeley.edu/group/swlh/acbar/
Bolocam • Observes at Caltech Submillimeter Observatory (10.4 m dish) • Hexagonal array of 144 bolometers • Array has a 7.5’ field-of-view with individual beam sizes of 30” FWHM • Sensitivity from the ground limited by temporal water vapor fluctuations • False detection rate is non-negligible http://www.cso.caltech.edu/bolocam
ACT: Atacama Cosmology Telescope • 6 Meter Aperture • Low Ground Pickup (< 20µK dc) • No Moving Optics • Remote Controlled • Flexible Focal Plane • Near the ALMA Site
APEX-SZ: Atacama Pathfinder Experiment • 16,500 feet in Chilean Andes. • 12m on-axis ALMA prototype Berkeley SZ Receiver: • 330 Bolometer array • 25% telescope time • Could discover 4000 Clusters/2yrs • Mass limit > 4x10¹⁴ M0 • First Light Fall 2004 • Observations in progress UC Berkeley/LBNL, MPI-Bonn/Munich, Cardiff
SPT: South Pole Telescope • First light achieved with the 10m South Pole Telescope, February 16, 2007. • Maps of Jupiter made, showing telescope and optics working as designed. • Plan to do 4,000 sq. degree survey at 90, 150 and 220 GHz at ~ arc minute resolution. The SPT is a collaboration between the U of Chicago, UC Berkley, Case Western Reserve University, U of Illinois, and Smithsonian Astrophysical Observatory
How many clusters? Adapted from J. Bartlett
Clusters at high z Bartlett 2001 SPT: 4000 deg2 ~100s of Planck clusters at z>1 (unresolved) ~1000s of SPT clusters at z>1 Planck: 30000 deg2 Adapted from J. Bartlett
Summary • Upcoming large yield cluster surveys would unveil a new era of doing cosmology with clusters. It has the promise to become 4th pillar of precision cosmology along with CMB, SNe and weak lensing. • These surveys provide us an opportunity to probe the enigma of dark energy with high precision, while at the same time probing the high l structure of the CMB
Sunyaev-Zel'dovic Effect γ γ e-
Antenna Extended Hemispherical lens substrate PolarBear • Ground-Based 3 meter Telescope at White Mountain CA • Characterize E-modes • Search for B-modes
SZ Effect: Equation In the Rayleigh-Jeans Regime: • The SZ temperature is a line-of-sight pressure integral of electron density (ne) and gas temperature (Te). • The SZ temperature decrement is redshift-independent: When the CMB photons interacted with the cluster, TCMB(z) was hotter and this compensates for cosmological dimming.
Why Clusters • SZ effect ideally suited for cluster surveying • Efficient at high z • Roughly uniform mass selection out to z>1 • Expectations 2007-2010: 10s => 1000s @ z>1 • Interferometers ~ 100 (~10% at z>1) • Bolometer cameras ~ 1,000 - 10,000 (~10% at z>1) • Planck ~10,000 all sky (~1% at z>1)