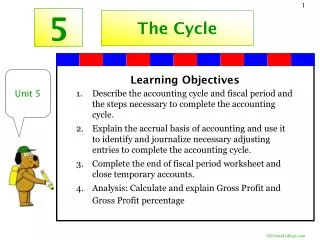
The Survey Cycle
The Survey Cycle. Sampling Overview. A quote …. “Why do they call it common sense? It isn’t that common.” - Mark Twain. The brief. Intro/first considerations Contracting out surveys Survey management Sampling issues Questionnaire development Pilot surveys/Sources of error

The Survey Cycle
E N D
Presentation Transcript
The Survey Cycle Sampling Overview
A quote … “Why do they call it common sense? It isn’t that common.” - Mark Twain
The brief • Intro/first considerations • Contracting out surveys • Survey management • Sampling issues • Questionnaire development • Pilot surveys/Sources of error • Data collection/processing • Data presentation • Completing the loop
Major themes • First considerations • Who do I need to survey? • How do I get representative samples? • Representative sampling strategies • Accuracy statements • Developing the questionnaire • Presenting the results • How do I manage this beast?
Excellent on line resources • www.stats.govt.nz/NR/rdonlyres/CA923AA8-BDF6-4EAD-834F-573F04EEF7A9/0/AGuidetoagoodSurvey.pdf • www.perseus.com/surveytips/Survey_101.htm • www.whatisasurvey.info
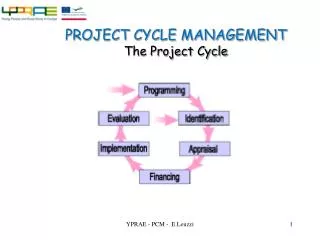
Understand the Problem STAGE 1: RESEARCH DEFINITION Identify Questions Refine/ReviseQuestions STAGE 2: RESEARCH PLAN/DESIGN Choose Design Determine Trade-offs Inventory Resources Assess Feasibility The process
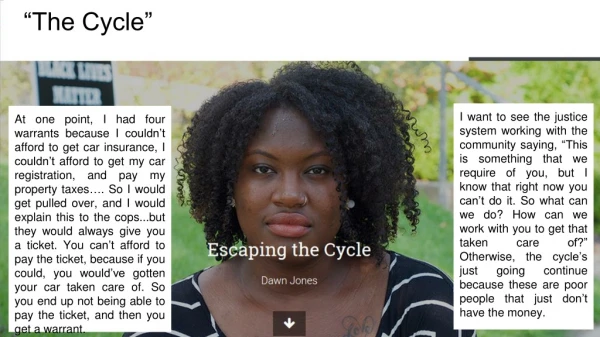
Motivating case study: crime & punishment • “The report presents the findings of the first comprehensive national survey of the views of a sample of adult New Zealanders about crime and the criminal justice system’s response to crime.”
Motivating case study: crime & punishment • …“the survey results were available to the Ministry’s policy staff working on the sentencing and parole reforms.”
Motivating case study: crime & punishment • “Since the survey was conducted in 1999, a major reform of the sentencing and parole regimes in New Zealand has taken place, with the commencement of the Sentencing Act 2002 and the Parole Act 2002 on 30 June 2002.”
What do you want to achieve? • What are the objectives? • What are the critical questions to be answered? • How will the results be used? • How will the results be communicated?
“Fools rush in where angels fear to tread...” • Do I have to do a survey? • Has this been done by someone else? • Literature search • Published Statistics/Other Government agencies • Surrogate information - proxies • Expert advice
Motivating case study: crime & punishment • Introduction 1 • 1.1 National surveys overseas • 1.2 Research at home • 1.3 The present study
s Published Stats/proxies example: Race and politics in New Caledonia • Recent presidential election in France – and therefore New Caledonia • Nicolas Sarkozy and Ségolène Royal • Anecdotal evidence suggests Kanaks (Melanesians) were more likely to vote for Ségolène • Election results available by region • No ethnicity question in latest census (2004) – Chirac banned it
Published stats/proxies example: Race and politics in New Caledonia • NC’s statisticians have come up with a ‘proxy’ measure • % of people (14+ years) by administrative region who speak a Melanesian language • Voting data available from “Les Nouvelles” newspaper
Published stats/proxies example: Race and politics in New Caledonia
Published stats/proxies example: Race and politics in New Caledonia
Failing this, I will need to conduct a survey (select) Population Sample (estimate) Parameter Statistic true proportion true mean sample proportion sample mean
Motivating case study: crime & punishment • “While no nation-wide survey focussing solely on attitudes towards crime and criminal justice issues has previously been conducted in New Zealand, some studies have touched on related topics. For example, in 1996, the National Survey of Crime Victims (Young et al. 1997)”….
Who do I need to survey? • Define who your target population is. • Examples: • Main household purchaser • Eligible voters • Recent insurance claimant
Motivating case study: crime & punishment • The sample comprised 1,000 interviews amongst the general population aged 18 years and over (the main sample) • Person-to-person survey was conducted…
How do I need to survey? • Types of surveys: • The three most common types of surveys, • mail/web surveys • telephone surveys • Person-to-person interviews.
Types of surveys • Survey costs are lowest for mail/web surveys • More expensive for telephone surveys • Most expensive for personal interviews • With well-trained interviewers, higher response rates and longer questionnaires are possible with personal interviews • The design of the questionnaire is critical
Telephone survey example • METHOD: Conducted by CATI (Computer Assisted Telephone Interviewing)
How much $$$ is needed? • Communication with Consumer Link
How do I sample these people? • Non-representative samples • Send letters out/ web requests 0800/0900 telephone requests – wait for replies • Self-selection bias • Convenience/judgment/snowball sampling
Non-representative samples • Sampling cost is lower and implementation easier • Statistically valid statements cannot be made about the precision of the estimates • There is some information but it cannot ‘retro-fitted’ to a different population • Why? You have no idea if the respondents are ‘representative’ of the people you are interested in.
Non-representative samples: Disaster • To prepare for her book Women and Love, Shere Hite (1976): • sent questionnaires to 100,000 women asking about love, sex, and relationships • 4.5% responded • Hite used those responses to write her book
Non-representative samples: Disaster • Moore (Statistics: Concepts and Controversies, 1997) noted: • respondents “were fed up with men and eager to fight them…” • “the anger became the theme of the book…” • “but angry women are more likely” to respond
Selection bias Population When parts of the population cannot be selected... …the sample cannot represent the whole population. Sample
Representative samples • The method use to pick interviewees relies on the bedrock of random sampling: • when the chance of selecting each person in the target population is known, • Then, and only then, do the results of the sample survey reflect the entire population • This is the reason that interviews with 1,000 NZ adults can accurately reflect the opinions of more than ~2 million NZ adults
Representative = random sample • Each person in a population has a KNOWN RANDOM PROBABILITY of being selected • Arrange yourself randomly about room • Distribute yourselves randomly in the room • E.g. randomly choose ½ of people from today • How?
Representativesamples: sample frames • A critical element in any survey is to locate (or “cover”) all the members of the population being studied so that they have a chance to be sampled. • To achieve this, a list - termed a “sampling frame” - is usually constructed The quality of the sampling frame is probably the dominant feature for ensuring adequate coverage of the desired population.
Sample frames • Any procedure and data that effectively enables the selection of a sample • Good frames require development and maintenance efforts • E.g. Statistics NZ runs an annual survey (the Annual Business Frame Update Survey) simply to update their Business Frame
Population Sample frame Sample frames • Most frames are imperfect, exhibiting • Undercoverage • Duplicated units (perhaps under different spellings or ID numbers) • Out-of-date or missing data
Telephone sampling of households • Under-coverage is a fundamental problem for telephone surveys of households • Only 92% of households have a land-line • Less than 80% of Maori or Pacific households • Households without phones are also different in other ways; e.g. they are generally low-income households • Duplicates also occur • i.e. some households have more than one phone number, and thus have more chance of being selected
Telephone sampling frames … • White Pages • Telecom sells random samples of listed numbers • Unlisted numbers not included • So have lost another 15% of phone numbers • May be cheaper to use paper directories instead, but these are out of date (even when just distributed)
Telephone sampling frames … • Random digit dialing (RDD) • Naïve approach • List all possible numbers, and select at random • Many non-working numbers - success rate <10%
Telephone sampling frames … • Better approaches • E.g. Mitofsky-Waksberg • Take banks of possible phone numbers, and select phone numbers more intensively from banks that have larger proportions of listed numbers • Increased hit rate to 60% in US • Pseudo-RDD methods using banks centered on valid “seed” phone numbers are sometimes used
Household sampling for in-home surveys • Multi-stage approach widely used • Area sample • take list of areas and select sample of areas • 38,366 mesh blocks in NZ Geostatistical System
Household sampling for in-home surveys • Household sample • Interviewers list all dwellings within selected mesh-blocks (following mesh-block maps) • Sample of households selected in each area • Variations on this approach exist • Random route within area (i.e. route follows rules from random starting point), or ignoring area boundaries
Motivating case study: crime & punishment • “The main sample comprising 1006 adults was drawn from 1500 households in 14 locations throughout New Zealand.” • “The locations were defined in terms of region and area type and were designed to ensure a fully representative cross-section of the New Zealand population aged 18 years and over.”
Motivating Case Study: Crime & Punishment • The population consists of all households in NZ • Sampling frame = area units • 200 regions chosen randomly within 14 regional strata • 5 households per region • Random adult chosen within each household
Business frames • Business Directory • Excellent frame held by Statistics NZ • Contained 278,000 non-farming enterprises in Feb ‘01 • Not available for market research surveys • Other business frames are marketing databases • Dun & Bradstreet, UBD, Yellow Pages