Download
1 / 1
10 likes | 154 Vues
A. B. C. Expression signal intensity [log 2 ratio]. Expression signal intensity [log 2 ratio]. Expression signal intensity [log 2 ratio]. 0 1 2 3 4 5 6. 0 1 2 3 4 5 6. 0 1 2 3 4 5 6. CNV.

E N D
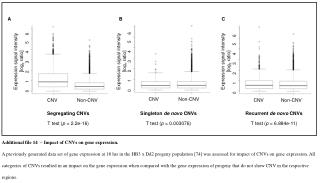
A B C Expression signal intensity [log2 ratio] Expression signal intensity [log2 ratio] Expression signal intensity [log2 ratio] 0 1 2 3 4 5 6 0 1 2 3 4 5 6 0 1 2 3 4 5 6 CNV Non-CNV CNV Non-CNV CNV Non-CNV Additional file 14 – Impact of CNVs on gene expression. A previously generated data set of gene expression at 18 hrs in the HB3 x Dd2 progeny population [74] was assessed for impact of CNVs on gene expression. All categories of CNVs resulted in an impact on the gene expression when compared with the gene expression of progeny that do not show CNV in the respective regions. Segregating CNVs T test (p < 2.2e-16) Singleton de novo CNVs T test (p = 0.003076) Recurrent de novo CNVs T test (p = 6.884e-11)