ANOVA (Analysis Of Variance) Wyatt Beyers 080919
ANOVA (Analysis Of Variance) Wyatt Beyers 080919. What test should you use? First, what type of data do you have?. Examples of Discrete Data (can be counted) Sides on a dice Number of melanosomes in a melanocyte. Examples of Continuous Data (can’t be counted) Fluorescence Intensity

ANOVA (Analysis Of Variance) Wyatt Beyers 080919
E N D
Presentation Transcript
What test should you use? First, what type of data do you have? Examples of Discrete Data (can be counted) • Sides on a dice • Number of melanosomes in a melanocyte Examples of Continuous Data (can’t be counted) • Fluorescence Intensity • Protein Concentration • Cell Size Most data I work with is continuous data, meaning there are an infinite number of values that a measurement can take.
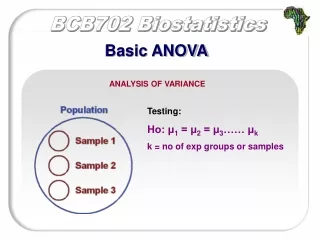
ANOVA (Analysis Of Variance) • An ANOVA uses the F test – comparison of variance • Significance test used to compare >2 means • Reveals if a difference is present • Does NOT reveal which sample means are different • If there is no significance found, the test is concluded • If there is a difference Post-hoc test (Tukey or Scheffe test)
Post-hoc pairwise comparison tests • “Rule of thumb”: Use Tukey test when samples are equal in size and Scheffe’s test if samples differ in size. • These tests are similar to a T test in that they do pairwise comparisons, but are adjusted so that they account for the fact that more than 2 means are compared.
One Way vs Two Way ANOVA • One way used if you are only comparing one variable • Example: Bacteria strain influence on recombinant protein yield • Two way used if you are testing two independent variables in the same experiment. • Example: Bacteria strain AND media type influence on protein yield • Does not only determine if each has an influence independently, but if there is interaction effect…Maybe strain has no influence on protein yield in LB Broth, but in 2XYT strain has a major influence. In other words, it tests whether the independent variables are truly independent or if they are somehow connected.
Why can’t I just do multiple pairwise t tests? • “With T test, only 2 means at a time are compared • F test compares all means at once • The more T tests that are conducted, more likely to find significant differences by chance alone (Type I error) • Many means to compare more tests required • For 10 means, 45 t tests required” • ANOVA greatly reduces Type I errors as the number of treatments to compare increases -Elementary Statistics, Allan Bluman
Conducting a One-Way ANOVA • Not something you calculate by hand, but if you wanted to….
So, how to calculate ANOVA practically? • Online ANOVA and Tukey calculator https://astatsa.com/OneWay_Anova_with_TukeyHSD/ • Input number of treatments • Copy and paste all of your raw data for each treatment that you want to compare • Matlab is free for CSU students and can automate your statistics! • Built in Anova functions make it easy to compare your data
Example: script in matlab performs ANOVA and Tukey test on raw data and generates bar graph with significance stars
Meet with me if you would like to learn how to use matlab for ANOVA! • Wyatt.beyers@colostate.edu