LTPP Solar PV Performance and Cost Estimates
650 likes | 1.04k Vues
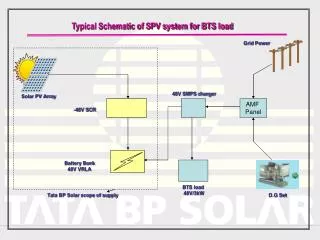
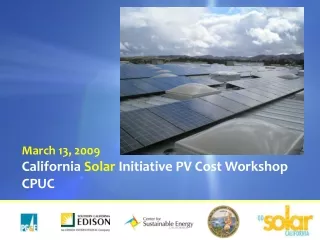
LTPP Solar PV Performance and Cost Estimates. Ryan Pletka, PE June 18, 2010. PV Performance Estimates. Definitions. DC Capacity. AC Capacity. AC Output. DC Capacity Sum of module nameplate rating. Modeled as 20 percent higher than inverter nameplate rating. AC Capacity –

LTPP Solar PV Performance and Cost Estimates
E N D
Presentation Transcript
LTPP Solar PVPerformance and Cost Estimates Ryan Pletka, PE June 18, 2010
Definitions DC Capacity AC Capacity AC Output • DC Capacity Sum of module nameplate rating. Modeled as 20 percent higher than inverter nameplate rating. • AC Capacity – Sum of inverter nameplate rating. M Inverter Black & Veatch - 3
Definitions Continued • AC Annual Energy Output The total energy output on an annual basis at the energy meter. This number includes dc and ac wiring losses. • AC Capacity Factor = AC Annual Energy Output [kWh] / (AC Capacity [kW] * 8760 [hours per year]) • DC Capacity Factor = AC Annual Energy Output [kWh] / (DC Capacity [kWp] * 8760 [hours per year]) Black & Veatch - 4
Overview of Performance Estimate Methodology • System definition • Chose 4 representative locations and 4 system configurations • Developed high-level conceptual design • Gathered solar resource data (TMY – Typical Meteorological Year) • Modeled system performance in PVSYST • Similar methodology as that used by B&V’s Solar Performance Group for more than 100 operating and proposed PV projects, most in California Black & Veatch - 5
System DefinitionsSize and Locations Black & Veatch - 6
Conceptual Design Basis Black & Veatch - 7
Modeling Locations & Resource Data North Coast Central Valley • Defined regions that team felt had significantly different PV deployment potential and performance characteristics • Identified representative locations in each region for which to pull solar data • NREL’s TMY3 data chosen to be representative of each location • TMY3 data of Class II or higher chosen South Coast Desert Black & Veatch - 8
Modeling and Loss Assumptions • System Voltage: 600 Vdc • Module Quality: According to typical warranties • Row Spacing: Assumed to be sufficient enough for no inter-row shading between 9 am and 3 pm all year. • Thermal Parameters: According to mounting (roof mount, ground mount) • Soiling: Weather conditions in each region assessed to develop soiling loss assumptions. • AC wiring loss: 0.5 percent • DC wiring loss: 1.5 percent • Transformer loss: 1 percent • Availability loss: 1 percent, that is, system assumed to be available (operating) 99 percent of the time Black & Veatch - 9
Performance Estimates Black & Veatch - 10
PV Cost Estimates - 11
Cost Development Approach • Detailed bottoms-up estimate based on B&V’s engineer-procure-construct (EPC) methodology • Market Pricing • Costs for projects where Black & Veatch is owner’s engineer or lender’s engineer • Financial statements for module suppliers (e.g., First Solar) • Recent project announcements/public/private data (other market information) • Hundreds of recent PPA bids • All capital costs are on a $/Wdc basis and assume 2010 commercial operation date Black & Veatch - 12
Cost Uncertainty/Variability • Estimates are inherently uncertain and costs in the PV industry are “dynamic” • The costs of CSI projects and other market sources appear to vary by approximately +/- 25 percent • This variation is due to site specific factors, owner specific factors, and component/system pricing • Site specific factors are usually captured in the BOS and might include rooftop mounting issues, grading or foundation issues, shading considerations, interconnection issues or similar • Owner specific factors are captured in the Owner’s costs and might include permitting issues, legal issues, land acquisition, or owner’s management issues • Component/system pricing variation is related to market supply vs. demand, market efficiency, timing, etc. Black & Veatch - 13
Black & Veatch Cost Estimates for PV Systems Based on configurations identified earlier As stated previously, typical cost uncertainty is +/- 25% Black & Veatch - 14
Comparison of PV Costs, Plus Large Central Station Costs Black & Veatch - 15
Example Breakdown of Component Costs 20 MW5 MW • Module 1.65 $/watt 1.65 $/watt • Support structure 0.82 $/watt 0.84 $/watt • Inverter 0.24 $/watt 0.25 $/watt • BOS 0.31 $/watt 0.40 $/watt • Owner’s Costs 0.68 $/watt0.76 $/watt • Total Capital Req. 3.70$/watt 3.90 $/watt Black & Veatch - 16
Appendix Material - 17
Details on Component Costs Black & Veatch - 18
Module cost (5 MW and 20 MW) • Black & Veatch has seen estimates between 1.3 and 2.25$/watt • From Review of First Solar Financial Statements we derive 1.63$/watt • From April 2010 SEIA report, SEIA indicates average 2009 costs at 1.85 to 2.25 $/watt. • We have chosen 1.65 $/watt, which is near the First Solar data point and slightly below the midpoint (1.77) of the Black & Veatch low observation of 1.3$/watt and high SEIA point of 2.25$/watt Black & Veatch - 19
Structure Cost (5 MW and 20 MW) • We have chosen 0.82-0.84 $/watt which is the result of reviewing quotes from three manufacturers. Black & Veatch - 20
Inverter Costs (5 MW and 20 MW) • We have chosen 0.24-0.25 $/watt which is based on our experience, and verified with multiple vendors Black & Veatch - 21
BOS Cost (5 MW and 20 MW) • BOS includes commodities like trenching, wire, electrical connections and grounding rods, step-up transformer, and similar items • We have chosen 0.31 -0.40 $/watt after completing a bottoms up estimate. Black & Veatch - 22
Owner’s Costs (5 MW and 20 MW) • Owner’s costs include spare parts, water supplies, project development, owner’s project management, sales and other taxes, insurance, advisory fees, legal, financing (including interest during construction), land/roof acquisition (as applicable), startup and construction support. There is a high degree of variation in this item due to unique customer approaches. • We have chosen 0.68-0.76 $/watt after reviewing actual owner’s costs for three development projects and reviewing allocation percentages made for previous studies (up to 25 percent) Black & Veatch - 23
Analysis of Data from California Solar Initiative • Reported system cost data for systems installed under CSI • Generally <1 MW • Data is known to contain errors and other inconsistencies • Data source: CSI PowerClerk, June 9, 2010 • Ratings are reported nameplate rating (kW dc) Black & Veatch - 24
Economies of Scale – Data from Installed Systems >100 kW Data source: CSI PowerClerk, June 9, 2010 Black & Veatch - 25
Falling System Costs – Installed Systems Only Data source: CSI PowerClerk, June 9, 2010 Black & Veatch - 26
Data from Pending Applications Indicates Potentially Lower Costs, But Should be Treated Cautiously (Systems >750 kW Only) CSI Status Data source: CSI PowerClerk, June 9, 2010 Black & Veatch - 27
Most Recent CSI Pending Applications, >300kW Data source: CSI PowerClerk, June 9, 2010 Black & Veatch - 28
Most Recent CSI Pending Applications, >300kW Reporting errors? Average $/kW = 5,050/kW Data source: CSI PowerClerk, June 9, 2010 Black & Veatch - 29
Performance Estimates for Large 150 MW SitesDC Capacity Factor Desert • Thin Film: 21.3% • Tracker: 23.2% Central Valley • Thin Film: 18.8% • Tracker: 21.3% Black & Veatch - 30
LTPP Solar PVPotential and Levelized Cost of Energy (LCOE) June 18, 2010
Overview of Presentation • DG PV Potential estimates by size and location • Methodology • Results • Levelized cost of energy estimates by size and location • LCOE Tool • Results • Appendix • Potential Estimates • LCOE Input Assumptions (also available in tool on website)
Goals of Potential Analysis • Develop PV Potential estimates • Identify ‘Easy to connect’ and ‘harder to connect’ • 4 size and configuration categories • 0.5 – 2 MW Roof, 0.5 – 2 MW Ground, 2 – 5 MW Ground, 5 – 20 MW Ground • 4 locations across California • Desert, Central Valley, North Coast, South Coast
PV Potential Estimation • Adjusted the 33% RPS Implementation Analysis potential study approach • Same underlying proprietary utility substation loadings and locations as used previously • Same large rooftop potential with satellite imagery • Key changes • Added small roofs in rural areas • “Set aside” potential for current programs
Screening Assumptions • ‘Easy’ Interconnection • Nameplate PV system is less than or equal to 30% of peak load at point of interconnection to avoid reverse flow • Participation • 33% of large roof owners will participate • Penetration • 33% of feeders accommodate ground-mounted systems up to the ‘easy’ interconnection limits • 33% of RETI identified large PV sites can be interconnected with a moderate transmission interconnection cost • 10% of rural ‘easy’ interconnection potential in small roofs
PV Potential Screening Method RETI Identified 20MW Projects Peak Loading on Each Substation Urban Location Rural Location 30% ‘Easy’ Interconnection Large Roof Potential 90% to Ground Mounted 33% Participation of Roofs 10% to Small Roofs 33% Penetration at Moderate Cost 33% Penetration 30% of Peak Load Screen 2/3 Remaining Potential Ground Mounted ‘Hard’ Interconnect Ground Mounted ‘Easy’ Interconnect Large Rooftop Small Rooftop
Screening Steps • Raw Potential (MWs): RETI Identified Sites Substation Load Total 27,500 39,323 • After Screening (MWs): • After Removing Existing Programs (MWs):
Goals of PV LCOE Analysis Create a publicly available pro-forma tool that calculates a levelized cost (LCOE) Develop model inputs Capital Costs and Operating Costs Performance parameters Financing assumptions Calculate levelized cost of solar PV Standardize the LCOE presentation
PV Financial Pro Forma Tool Balance complexity vs. applicability for a broad range of projects Some of the features: Debt Service Coverage Ratio (DSCR) limit Inverter replacement fund Debt service reserve fund Available on E3 website for download; http://www.ethree.com/public_projects/cpuc6.html
Example – Model Inputs Location: DesertTechnology: 5-20 MW Ground Mounted System Cost & Performance Inputs: Financing Inputs:
Example – Cash flow Location: DesertTechnology: 5-20 MW Ground Mounted • Screenshot of cash flow:
PV Bid Pricing vs. LCOE The same $/kWh price can be presented in several different ways PV bids typically reflect the price before Time of Day (TOD) factors are applied Developers see the post-TOD value, which is the true cost of the PV system Escalators can skew costs when compared to flat levelized costs Results herein are post-TOD, flat nominal levelized
Comparison: PV LCOE metrics Post-TOD flat nominal levelized used to show results Post Time-Of-Delivery (TOD) Flat nominal levelized: $0.1678/kWh Pre-TOD Flat nominal levelized*: $0.1266/kWh LCOE LCOE Year Year Pre-TOD Year-1 cost with escalator* : $0.1087/kWh LCOE Post-TODYear-1 cost with escalator: $0.1441/kWh LCOE Year Year Note: Costs shown correspond to a project in the 5-20MW ground mounted category in the desert.*Using a TOD factor of 1.3257 (SCE TOD schedule using TMY3 output data from Daggett with a ground mounted 25°fixed tilt system)
Direction of electricity flow RETI PV Projects Assumed To flow in Opposite direction Diagram of Interconnection Points
Distributed Solar PV 20 MW sites near non-urban 69 kV substations Smaller projects on rooftops, large commercial rooftops with 0.25 MW potential Limited by 30% peak load at a given substation Illustrative Example of Distributed Solar PV 20 MW near substations Large commercial rooftops Residential rooftops
Ground Mounted PV Initial criteria near sub stations equal or less than 69 kV agricultural or barren land less than 5% slope Environmental screen Black out areas Yellow out areas Land parcel a continuous 160 acre plot (20 MWp) within 20 miles More than 5% slope area Black out area Yellow out area Example Map for Solar PV Non-Urban Projects 69 kV substation Agricultural or barren land Substation Urban Solar PV plant