Download

1 / 119
1.29k likes | 1.85k Vues
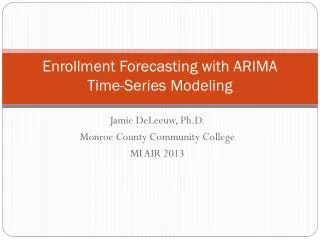
Frequency Domain Techniques i n Forecasting with ARIMA Model. Dr. M. J ahanur Rahman Associate Professor Department of Statistics University of Rajshahi , Rajshahi-6205, Bangladesh Jahan.stat@ru.ac.bd July 28, 2012. Contents. Time Series? Time domain forecasting with ARIMA model

E N D
Frequency Domain Techniques in Forecasting with ARIMA Model Dr. M. JahanurRahman Associate Professor Department of Statistics University of Rajshahi, Rajshahi-6205, Bangladesh Jahan.stat@ru.ac.bd July 28, 2012
Contents • Time Series? • Time domain forecasting with ARIMA model • Transformations from time domain to frequency domain • Frequency domain techniques in forecasting with ARIMA model Dr. M. Jahanur Rahman, R.U.
Time Series A sequence of observations indexed by time, denoted by or Monthly relative humidity time series of Rajshahi Dr. M. Jahanur Rahman, R.U.
Random Process to Time Series Let be a sequence of random variable indexed by time t. = Realization or Sample path Time Series? A finite realization of a time series process Dr. M. Jahanur Rahman, R.U.
Note that • Time series is only one of the many possible realizations (sample paths) that the history might have generated. • Time series analysis is trying to draw statistical inference from a single outcome (time series), even partially observed. Dr. M. Jahanur Rahman, R.U.
? How can we make sensible inferences on the underlying time series process with a single observation We need a strong assumption: Stationarity (or ergodicity). This assumption treat the time series as a random sample from the same underlying population (process). Dr. M. Jahanur Rahman, R.U.
Stationary Time Series A time series is weak stationaryif its mean, variance, and autocovariance (at various lags) remain the same no matter at what point of time we measure them. That is, they are time invariant. Mean = Variance = Covariance = Mean = Variance = Covariance = Mean = Variance = Covariance = Mean = Variance = Covariance = Mean = Variance = Covariance = Dr. M. Jahanur Rahman, R.U.
Ergodicity Mean = Variance = Covariance = Mean = Variance = Covariance = Mean = Variance = Covariance = Mean = Variance = Covariance = Mean = Variance = Covariance = a realization (a sample path) Dr. M. Jahanur Rahman, R.U.
Ergodicity Mean = Variance = Covariance = Mean = Variance = Covariance = Mean = Variance = Covariance = Mean = Variance = Covariance = Mean = Variance = Covariance = Mean = Variance = Covariance = • The covariance-stationary process is ergodic for the mean. • The covariance-stationary process is ergodic for the variance. • The covariance-stationary process is ergodic for the covariance. Dr. M. Jahanur Rahman, R.U.
Stationary time series Non-stationary time series Non-stationary time series (Non)Stationay Time Series Dr. M. Jahanur Rahman, R.U.
Non-stationary Time Series • Non-stationary time series contain two kinds of trends: • Deterministic trend • Stochastic (random) trend Dr. M. Jahanur Rahman, R.U.
Non-stationary Time Series Trend Stationary: If y(t) contains a deterministic trend and {y(t) – trend} becomes stationary. Then y(t) is known as trend stationary. Difference Stationary: If y(t) contains a stochastic trend and {y(t) – y(t-1)} becomes stationary. Then y(t) is known as difference stationary. Dr. M. Jahanur Rahman, R.U.
Non-stationary Time Series Dr. M. Jahanur Rahman, R.U.
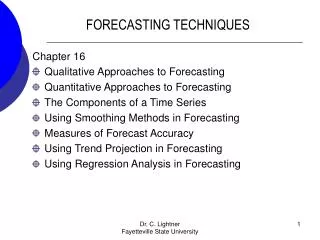
Components of a Time Series Any time series can contain some or all of the following components: 1. Trend (T) 2. Cyclical (C) 3. Seasonal (S) 4. Irregular (I) Trend component The trend is the long term pattern of a time series. A trend can be positive or negative depending on whether the time series exhibits an increasing long term pattern or a decreasing long term pattern. Dr. M. Jahanur Rahman, R.U.
Components of a Time Series Any time series can contain some or all of the following components: 1. Trend (T) 2. Cyclical (C) 3. Seasonal (S) 4. Irregular (I) Cyclical component Any pattern showing an up and down movement around a given trend is identified as a cyclical pattern. The duration of a cycle depends on the type of business or industry being analyzed. Dr. M. Jahanur Rahman, R.U.
Components of a Time Series Any time series can contain some or all of the following components: 1. Trend (T) 2. Cyclical (C) 3. Seasonal (S) 4. Irregular (I) Seasonal component Seasonality occurs when the time series exhibits regular fluctuations during the same month (or months) every year, or during the same quarter every year. For instance, retail sales peak during the month of December. Dr. M. Jahanur Rahman, R.U.
Components of a Time Series Any time series can contain some or all of the following components: 1. Trend (T) 2. Cyclical (C) 3. Seasonal (S) 4. Irregular (I) Irregular component This component is unpredictable. Every time series has some unpredictable component that makes it a random variable. In prediction, the objective is to “model" all the components to the point that the only component that remains unexplained is the random component. Dr. M. Jahanur Rahman, R.U.
Components of a Time Series Dr. M. Jahanur Rahman, R.U.
Two Domains • Traditionally, there are two ways to analyze time series data: • Time domain analysis • Time domain analysis examines how a time series process evolves through time, with tools such as autocorrelation function. • Frequency domain analysis • Frequency domain analysis, also known as spectral analysis, studies how periodic components at different frequencies describe the evolution of a time series. Dr. M. Jahanur Rahman, R.U.
Two Domains Frequency Frequency domain Time Time domain Dr. M. Jahanur Rahman, R.U.
Time Series Model The Autoregressive Integrated Moving Average (ARIMA) models, or Box-Jenkins models, are a class of linear models that is capable of representing stationary as well as non-stationary time series. Dr. M. Jahanur Rahman, R.U.
ARIMA(p,d,q) Model • = Response (dependent) variable at time • = Respose variable at time lags • = difference operator () • = White noise error term • = Errors in previous time periods • = parameters • = Number of autoregressive terms • = Number of moving average terms. Dr. M. Jahanur Rahman, R.U.
ARIMA(p,0,q) = ARMA(p, q) Model ARIMA(p,0,0) = AR(p) Model ARIMA(0,0,q) = MA(q) Model Dr. M. Jahanur Rahman, R.U.
ARIMA models rely heavily on both autocorrelation (AC) and partial autocorrelation (PAC) patterns in time series data. Dr. M. Jahanur Rahman, R.U.
Theoretical pattern of ACF and PACF ACF 0 PACF = 0 for lag > 2 PAC AC 1 2 3 4 5 6 7 …….. Lags 1 2 3 4 5 6 7 …….. Lags ARIMA(2,0,0) = AR(2) ACF = 0 for lag > 2; PACF 0 AC PAC 1 2 3 4 5 6 7 …….. Lags 1 2 3 4 5 6 7 …….. Lags ARIMA(0,0,2) = MA(2) ACF PACF 0 PAC AC 1 2 3 4 5 6 7 …….. Lags 1 2 3 4 5 6 7 …….. Lags ARIMA(2,0,2) = ARMA(2, 2) Dr. M. Jahanur Rahman, R.U.
Choosing an ARIMA model Theoretical pattern of ACF and PACF • ARIMA modeling requires a great deal of skill, which of course come from practice. Dr. M. Jahanur Rahman, R.U.
1. Identification of the model (choosing tentative p, d, p for ARIMA) 2. Parameter estimation of the chosen model. 3. Diagnostic checking (are the estimated residual white noise?) no yes 4. Forecasting Box-Jenkins (BJ) Methodology Dr. M. Jahanur Rahman, R.U.
Steps of modeling a observed time series with ARIMA Dr. M. Jahanur Rahman, R.U.
Original time series [ Log transformation Dr. M. Jahanur Rahman, R.U.
Seasonal differencing Regular differencing Dr. M. Jahanur Rahman, R.U.
Correlogram: Shows SAC & SPAC at different lags Dr. M. Jahanur Rahman, R.U.
Choosing an ARIMA model PAC AC 1 2 3 4 5 6 7 …….. 1 2 3 4 5 6 7 …….. Lags ARIMA(2,0,0) = AR(2) AC PAC 1 2 3 4 5 6 7 …….. Lags 1 2 3 4 5 6 7 …….. ARIMA(0,0,2) = MA(2) PAC AC Competitive Models: (1) ARMA(2, 0) (2) ARMA(0, 1) (3) ARMA(2, 1) 1 2 3 4 5 6 7 …….. Lags 1 2 3 4 5 6 7 …… ARIMA(2,0,2) = ARMA(2, 2) Dr. M. Jahanur Rahman, R.U.
Looking for the best Model Dr. M. Jahanur Rahman, R.U.
Finally Forecasting Dr. M. Jahanur Rahman, R.U.
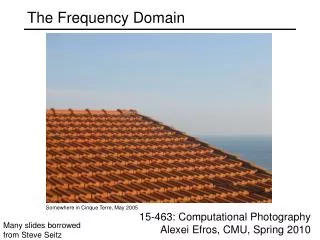
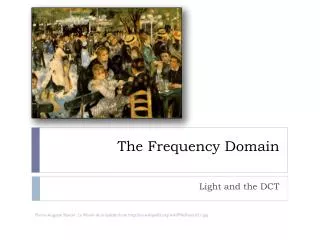
Frequency Domain • Fourier Transformation • Short-time Fourier Transformation • Wavelet Transformation
Frequency Domain Time Domain Frequency Domain • To get further information from the time series that is not readily available in the time domain. Dr. M. Jahanur Rahman, R.U.
Time Domain • Autocorrelation function or correlogram is used for analyzing time series in time domain. Correlogram rk • Time series Yt k Periodicities in data can be best determined by analyzing the time series in frequency domain. t Periodic process with noise Dr. M. Jahanur Rahman, R.U.
Frequency Domain Time Domain Frequency Domain • Transformations: • Fourier Transformation (FT) • Short-time Fourier Transformation (SFT) • Wavelet Transformation (WT) • ……… Dr. M. Jahanur Rahman, R.U.
Time series analysis in frequency domain is known as frequency domain analysis or spectral analysis. Dr. M. Jahanur Rahman, R.U.
The Basics = Amplitude (height of the function), R > 0 = Frequency (cycle/unit time) = Phase (the starting point of the cosine function which lies in ) (period). Dr. M. Jahanur Rahman, R.U.
The Basics • t = running from 1 to 100. • Red curve has , = 4/100 = 1/25 and • Blue curve has , = 4/100 = 1/25 and • Black curve has , = 4/100 = 1/25 and Dr. M. Jahanur Rahman, R.U.
The Basics as Dr. M. Jahanur Rahman, R.U.
The Basics Jean Baptiste Joseph Fourier (1768-1830) Dr. M. Jahanur Rahman, R.U.
Mathematical Concepts Dr. M. Jahanur Rahman, R.U.
Fourier Series According to Fourier, any function in can be defined as So Dr. M. Jahanur Rahman, R.U.
Fourier Series or equivalently, Where for Dr. M. Jahanur Rahman, R.U.
Time domain to Frequency Domain y(t) Y(f) Time (t) Frequency (f) Time Domain Frequency Domain Dr. M. Jahanur Rahman, R.U.
Time domain to Frequency Domain 2f 5f 2f 5f Frequency Domain Time Domain Dr. M. Jahanur Rahman, R.U.
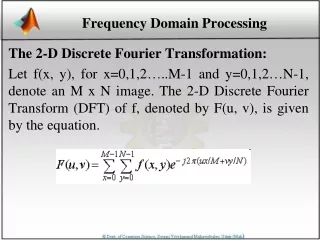
Discrete Fourier Transformation (DFT) Let a time sequence and a frequency sequence The DFT of is Where • Note that and are of the same size. • The DFT of a time series is another time series. Dr. M. Jahanur Rahman, R.U.
Inverse Discrete Fourier Transformation (IDFT) The inverse DFT (IDET) of , is given by DFT IDFT 40f 3f 6f • Fourier Transformation • Inverse Fourier Transformation. Dr. M. Jahanur Rahman, R.U.