Download
1 / 8
80 likes | 106 Vues
EGU2007-A-10961. NOAA-NASA and International OSSEs Team. OSSEs: Observing Systems Simulation Experiments JCSDA: Joint Center for Satellite Data Assimilation SWA: Simpson Weather Associates ESRL: Earth System Research Laboratory ( formerly FSL, CDC, ETL).

E N D
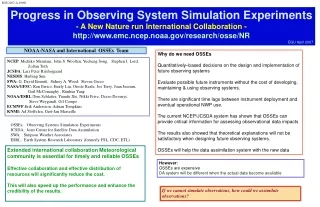
EGU2007-A-10961 NOAA-NASA and International OSSEs Team OSSEs: Observing Systems Simulation Experiments JCSDA: Joint Center for Satellite Data Assimilation SWA: Simpson Weather Associates ESRL: Earth System Research Laboratory(formerly FSL, CDC, ETL) Progress in Observing System Simulation Experiments - A New Nature run International Collaboration - http://www.emc.ncep.noaa.gov/research/osse/NR EGU April 2007 • Why do we need OSSEs • Quantitatively–based decisions on the design and implementation of future observing systems • Evaluate possible future instruments without the cost of developing, maintaining & using observing systems. • There are significant time lags between instrument deployment and eventual operational NWP use. • The current NCEP/JCSDA system has shown that OSSEs can provide critical information for assessing observational data impacts • The results also showed that theoretical explanations will not be satisfactory when designing future observing systems. • OSSEs will help the data assimilation system with the new data NCEP: Michiko Masutani, John S. Woollen, Yucheng Song, Stephen J. Lord, Zoltan Toth JCSDA: Lars Peter Riishojgaard NESDIS: Haibing Sun SWA: G. David Emmitt, Sidney A. Wood, Steven Greco NASA/GFSC: Ron Errico, Emily Liu, Oreste Reale, Joe Terry, Juan Juseum, Gail McConaughy , Runhua Yang NOAA/ESRL:Tom Schlatter, Yuanfu Xie, Nikki Prive, Dezso Devenyi, Steve Weygandt, Gil Compo ECMWF:Erik Andersson, Adrian Tompkins KNMI: Ad Stoffelen, Gert-Jan Marseille Extended international collaboration Meteorological community is essential for timely and reliable OSSEs Effective collaboration and effective distribution of resources will significantly reduce the cost. This will also speed up the performance and enhance the credibility of the results. However: OSSEs are expensive DA system will be different when the actual data become available If we cannot simulate observations, how could we assimilate observations?
New Nature Run by ECMWFBased on Recommendations by JCSDA, NCEP, GMAO, GLA, SIVO, SWA, NESDIS, ESRL Nature Run: Serves as a true atmosphere for OSSEs Preparation of the Nature Run and simulation of basic observations consume a significant amount of resources. If different NRs are used by various DAs, it is hard to compare the results. Need one good new Nature Run which will be used by many OSSEs. Share the simulated data to compare the OSSE results from various DA systems to gain confidence in results. Data Format: Grib1 Model level data: Reduced Gaussian in model resolution Surface data: Reduced Gaussian in model resolution Modification done for OSSEs: Geopotential height for model level Increased pressure level data (31 levels) Potential temperature level. Precipitation and radiance (change the units) Low Resolution Nature Run Spectral resolution : T511 Vertical levels: L91 3 hourly dump Initial conditions: 12Z May 1st, 2005 Ends at: 0Z Jun 1,2006 Daily SST and ICE: provided by NCEP Model: Version cy31r1 Completed in July 2006, rerun October 2006 Supplemental 1degx1deg data Pressure level data:31 levels Potential temperature level data: 315,330,350,370,530K Selected time series for surface data: Convective precip, Large scale precip, MSLP,T2m,TD2m, U10,V10, HCC, LCC, MCC, TCC, Sfc Skin Temp Other time series: All variables for potential temperature levels Variables: T,U,V,VO,D,Z, W, Q at 1000,850,700,500,300,250,200,100,50,10 hPa High Resolution Nature Run for a selected period Hurricane season is recommended T799 resolution, 91 levels, one hourly dump Get initial conditions from low resolution-NR
Forecast run is used for the Nature Run Archive and Distribution Because the real atmosphere is a chaotic system governed mainly by conditions at its lower boundary, it does not matter that the Nature Run diverges from the real atmosphere. The Nature Run should be a separate universe, ultimately independent from but parallel to the real atmosphere. The Nature Run must have the same statistical behavior as the real atmosphere in every aspect relevant to the observing system under scrutiny. A succession of analyses is a collection of snapshots of the real atmosphere. Each analysis marks a discontinuity in model trajectory. Considering a succession of analyses as truth seems to be a serious compromise in the attempt to conduct a “clean” experiment. I favor a long, free-running forecast as the basis for defining “truth” in an OSSE. -- from Tom Schlatter To be archived in the MARS system on the THORPEX server at ECMWF Accessed by external users expver=etwu Copies for US are available to designated users & users known to ECMWF NASA/GSFC/SIVO and THORPEX server at NCAR Proposed subset of the data: The complete surface data in reduced Gaussian (N256), Complete 1x1 pressure level data (0.16TB), Complete 1x1 isentropic data (0.018TB), A few days worth model level data to be posted for online access, The complete model level data (2.4TB) must be sent using hard disks. Simulated observations. Some OSSE results Currently available from NCEP ftp server. (Contact Michiko Masutani michiko.masutani@noaa.gov) Discussions forums Representativeness error Strategies of simulation of observation Evaluation of nature run cloud Diurnal cycle in Nature run
Initial Diagnostics of the Nature run Study of drift in NR Michiko Masutani (NCEP) NH mid-latitudes Area averaged precipitation Tropics Zonal wind June 2006 By Juan Carlos Jusem (NASA/GSFC) It takes about two to three weeks to settle tropical precipitation. - Michiko Masutani (NCEP/EMC) SH mid-latitudes NCEP reanalysis Convective precipitation Large Scale precipitation Total precipitation Nature Run The African Monsoon Region and the Tropical Atlantic Oreste Reale NASA/GSFC NH Cyclones Track Joe Terry NASA/GSFC and Thomas Jung (ECMWF) HL vortices: vertical structure Vertical structure of a HL vortex shows, even at the degraded resolution of 1 deg, a distinct eye-like feature and a very prominent warm core. -- Oreste Reale (NASA/GSFC/GLA)
Extratropical Cyclone StatisticsJoe Terry NASA/GSFC 1) Extract cyclone information using Goddard’s objective cyclone tracker • Nature Run • One degree operational NCEP analyses (from several surrounding years) • NCEP reanalysis for specific years (La Nina, El Nino, FGGE) 2) Produce diagnostics using the cyclone track information (comparisons between Nature Run and NCEP analyses for same month) • Distribution of cyclone strength across pressure spectrum • Cyclone lifespan • Cyclone deepening • Regions of cyclogenesis and cyclolysis • Distributions of cyclone speed and direction
Nature run **Total precipitation, against GPCP, SSMI, and XieArkin Comparison between the ECMWF T511 Nature Run against climatology 20050601-20060531, exp=eskb, cycle=31r1 Adrian Tompkins, ECMWF TechMemo 452 Tompkins et al. (2004) http://www.emc.ncep.noaa.gov/research/osse/NR/ECMWF_T511_diag/ tm452.pdf Jung et al. (2005) TechMemo 471 http://www.emc.ncep.noaa.gov/research/osse/NR/ECMWF_T511_diag/tm471.pdf Plot files are also posted at http://www.emc.ncep.noaa.gov/research/osse/NR/ECMWF_NR_Diag/ECMWF_T511_diag The description of the data http://www.emc.ncep.noaa.gov/research/osse/NR/ECMWF_T511_diag/climplot_README.html - These comparisons confirm the lack of rainfall over the tropical land masses. - We have an overestimation of precip over the high-SST regions in the tropics. - There is a tendency for deep convection to become locked in with the highest SSTs, which in the east Pacific results in a narrow ITCZ. - The TRMM NASDA-3b43 algorithm is presumed to be the most accurate of the two TRMM retrieval products.
Radiance Simulation System for OSSELars-Peter Riigeojgaard, Emily Liu, NASA/GSFC/GMAOand Haibing Sun (NOAA/NESDIS)Other resources and/or advisorsTom Kleespies, Paul Van Delst, Yong Han (JCSDA);Erik Andersson (ECMWF); Roger Saunders (Met Office) Simulation of Observation August 2005 is selected as the period for initial simulation 20-30 August (1) A hurricane that makes landfall in Florida and then dissipates in the southeastern United States. As you will see, this hurricane is suggested in my skewness plot. (2) A very intense extratropical cyclone in the Southern Hemisphere that reaches a pressure minimum of less than 925 hPa. It can be observed between 60S and 65S and between 105E and 115E. (Juan Carlos Jusem, NASA/GLA) Simulation of Conventional ObservationsJack Woollen (NCEP/EMC) and Joe Terry (NASA/SIVO) Considerations Data distribution depends on atmospheric conditions Cloud and Jet location, Surface orography, RAOB drift Initial simulation Simulation for August 2005 completed and posted from NCEP ftp site Simulation of DWL SWA simulates DWL planned by NASA KNMI simulates DWL from ESA Use common BUFR table and definitions SWA will simulate Cloud Motion Vectors - Advised by Chris Velden KNMI will simulate ASCAT Uniform Raob for testing Michiko Masutani(NCEP) UAS by Nikki Prive and Yuanfu Xie (NOAA/ESRL)
Evaluation of the results In US, Data assimilation will be conducted at NCEP/EMC, NASA/GMAO, and NOAA/ESRL Initial verification will be performed by the institutes where data assimilation is performed. The selected results will be posted through NASA/SIVO. Other institute including Universities will be able to participate in verification. Data assimilation: Gridpoint Statistical Interpolation (GSI) Various Forecast model Calibration coordinator: Michiko Masutani (NCEP/EMC) The results from data impact depend on variables and verification methods. The date impact depends on how the data is handled in the DA system. In calibrations of the OSSE, similarity in the amount of impact from existing data in the real and simulated atmosphere needs to be achieved. The difference needs to be explained based on the characteristics of the Nature Run. Need to select sets of experiments to be used for calibration and standard verification. Selected calibration experiments to be performed every time the DA system is changed. Discussion for calibration and verification strategies to be scheduled.