Download
1 / 18
180 likes | 292 Vues
Explore the role of graphical methods in linear regression analysis, revealing features missed by summary statistics. Learn about types of graphs, their functions before and after fitting a model, and how they detect outliers and explore relationships between variables. Understand how to interpret standardized residuals-based plots and conduct scatter plots for residual analysis.

E N D
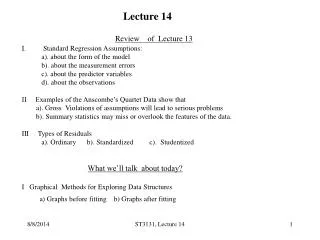
Lecture 14 • Review of Lecture 13 • Standard Regression Assumptions: • a). about the form of the model • b). about the measurement errors • c). about the predictor variables • d). about the observations • II Examples of the Anscombe’s Quartet Data show that • a). Gross Violations of assumptions will lead to serious problems • b). Summary statistics may miss or overlook the features of the data. • III Types of Residuals • a). Ordinary b). Standardized c). Studentized • What we’ll talk about today? • I Graphical Methods for Exploring Data Structures • a) Graphs before fitting b) Graphs after fitting ST3131, Lecture 14
Graphical Methods Graphical methods play an important role in data analysis, especially in linear regression analysis. It can reveal some important features that summary statistics may miss, e.g., the scatter plots of the Anscombe’s data. a). Graphs before fitting a model Functions: 1) Detect outliers 2) Suggest a model b). Graphs after fitting a model Functions: 1) Checking assumption violations 2). Detecting outliers ST3131, Lecture 14
Graphs before fitting a model • Functions: 1) Detect outliers, high leverage point or influential points • 2) Recognize the patterns • 3) Explore the relationship between variables • Types : 1). One-dimensional • 2). Two-dimensional • 3). Rotating plot • 4). Dynamic graphs ST3131, Lecture 14
One-dimensional graphs • Histogram • Stem-and-leaf display • Dot plot • Box plot • Functions: (1) Distribution of a single variable • (2) Detect outliers, high leverage points, or influential points • Two-dimensional graphs • Matrix plot: pair-wise scatter plot • Purpose: explore patterns of pair-wise variables ST3131, Lecture 14
Stem-and-leaf of Y N = 15 Leaf Unit = 0.10 2 10 88 3 11 0 4 11 2 6 11 45 6 11 7 11 9 (1) 12 0 7 12 3 6 12 4 5 12 66 3 12 8 2 13 01 ST3131, Lecture 14
Drawback when p>1, the scatter plots of Y vs Xj may or may not show linear patterns even when Y and X1, X2, …,Xp have a good or perfect linear relationship. Hamiltan’s Data ST3131, Lecture 14
Hamiltan’s Data : Y, X1, X2 Fitted Results: Y vs X1: Y=11.989+.004X1, t-test=.09, R_sq=0.0 Question: Y is uncorrelated with X1? Y vs X2: Y=10.632+.195 X2, t-test=1.74, R_sq=.188 Question: Y is uncorrelated with X2? Y vs X1, X2: Y=-4.515+3.097X1+1.032X2, F-test=39222, R_sq=1.0 Question: Y is almost perfectly linearly correlated with X1 and X2? Question: What assumption is violated by the Hamiltan’s Data? ST3131, Lecture 14
Rotating Plots: 3-dimensional plot Rotate the points in different directions s o that three-dimensional structure becomes apparent. Dynamic Graphs: p>3 Graphs are in a dynamic status instead of a static status. Good for exploring the structural and relationship in more than 3-dimensions. ST3131, Lecture 14
b) Graphs after fitting a model • Functions: 1) Checking assumptions, • 2) Detection of outliers, high leverage points, influential points • 3). Diagnostic plots for the effect of variables • Standardized Residuals-based Plots • Normal Probability Plot of standardized residuals: • ordered standardized residuals vs normal scores • Function: • Main Idea : If the residuals are normally distributed, the ordered standardized residuals should be approximately the same as the ordered normal scores. In this case, the plot should resemble a (nearly) straight-line with interceptand slope . ST3131, Lecture 14
2. Scatter Plots of standardized residuals against each of the predictor variables Function: Check linearity or homogeneity assumptions on Xj Main Idea: Under the standard assumptions, the standardized residuals are nearly uncorrelated with each of the predictor variables. In this case, the residual points should be randomly scattered in the range. For example, ST3131, Lecture 14
3. Scatter Plots of standardized residuals against the fitted values. Function: Check Independence, homogeneity of the measurement errors Linearity of the data Main Idea: Under the Independence, homogeneity of the measurement errors Linearity of the data assumptions, the standardized residuals are nearly uncorrelated with the fitted values. In this case, the residual points should be randomly scattered in the range, e.g., ST3131, Lecture 14
4. Index Plot of standardized residuals i. e. the scatter plot of standardized residuals against the indices of observations. Function: Check Independence, homogeneity of the measurement errors Linearity of the data Main Idea: Under the assumption of independence errors, the standardized residuals should be randomly scattered within a horizontal band around 0. ST3131, Lecture 14
After-class Questions: • Is graphics before fitting a model model-based? • Is graphics after fitting a model model-based? • Why is graphics sometimes more useful than a statistic? ST3131, Lecture 14