Download
1 / 6
60 likes | 199 Vues
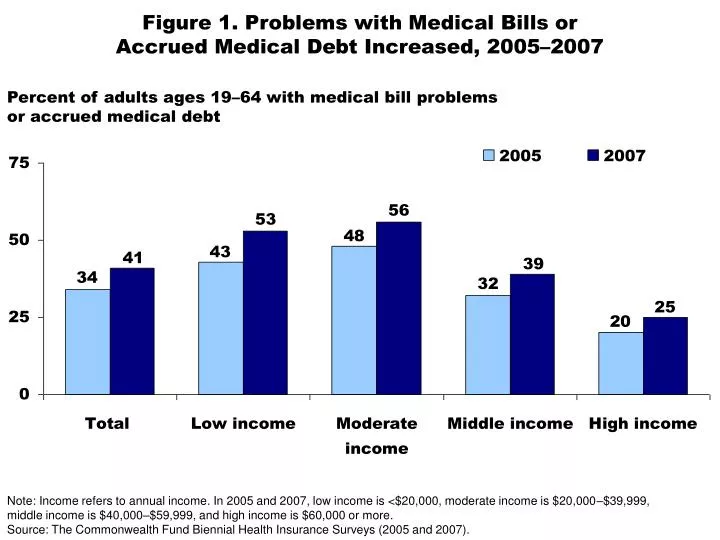
Figure 1. Problems with Medical Bills or Accrued Medical Debt Increased, 2005–2007. Percent of adults ages 19–64 with medical bill problems or accrued medical debt.

E N D
Figure 1. Problems with Medical Bills orAccrued Medical Debt Increased, 2005–2007 Percent of adults ages 19–64 with medical bill problemsor accrued medical debt Note: Income refers to annual income. In 2005 and 2007, low income is <$20,000, moderate income is $20,000–$39,999, middle income is $40,000–$59,999, and high income is $60,000 or more. Source: The Commonwealth Fund Biennial Health Insurance Surveys (2005 and 2007).
Figure 2. Medical Bill Problems and Accrued Medical Debt, 2005–2007 Percent of adults ages 19–64 Source: The Commonwealth Fund Biennial Health Insurance Surveys (2005 and 2007).
Figure 3. Uninsured Adults Are More Likely to Be Paying Off Large Amounts of Medical Debt Over Time Percent of adults ages 19–64 who are paying off medical bills over time Source: The Commonwealth Fund Biennial Health Insurance Survey (2007).
Figure 4. Sixty Percent of Underinsured or Uninsured AdultsReported Medical Bill Problems or Debt Percent of adults ages 19–64 *Includes only those individuals who had a bill sent to a collection agency when they were unable to pay it. Source: The Commonwealth Fund Biennial Health Insurance Survey (2007).
Figure 5. More Than One-Quarter of Adults Under Age 65with Medical Bill Burdens and DebtWere Unable to Pay for Basic Necessities Percent of adults ages 19–64 with medical bill problemsor accrued medical debt Source: The Commonwealth Fund Biennial Health Insurance Survey (2007).
Figure 6. Insured Adults with Less Comprehensive Coverage and Benefit Limits Are More Likely to FaceMedical Bill and/or Debt Problems Percent of continually insured adults ages 19–64 with bill and/or debt problems Has both Rx and dental coverage Has neither Rx nor dental coverage Deductible is less than 5% of income Deductible is more than 5% of income Annual premium is less than 10% of income Annual premium is 10% or more of income No expensive bills for services not covered Had expensive medical bills for services not covered by insurance MD did not charge more than insurance covered MD charged more than insurance would pay; patient paid difference Health plan does not limit total dollar amount Health plan limits total dollar amount Source: The Commonwealth Fund Biennial Health Insurance Survey, 2007.