Download
1 / 76
760 likes | 979 Vues
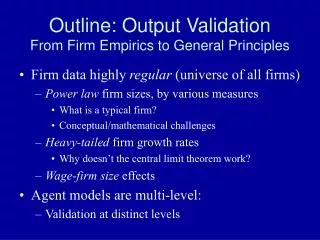
Outline: Output Validation From Firm Empirics to General Principles. Firm data highly regular (universe of all firms) Power law firm sizes, by various measures What is a typical firm? Conceptual/mathematical challenges Heavy-tailed firm growth rates

E N D
Outline: Output ValidationFrom Firm Empirics to General Principles • Firm data highly regular (universe of all firms) • Power law firm sizes, by various measures • What is a typical firm? • Conceptual/mathematical challenges • Heavy-tailed firm growth rates • Why doesn’t the central limit theorem work? • Wage-firm size effects • Agent models are multi-level: • Validation at distinct levels
Summary from Yesterday • Interacting agent model of firm formation • Features of agent computing: • Agents seek utility gains; perpetualadaptation emerges • Intrinsically multi-level • Full distributional information available • Potentially costly: • Sensitivity analysis • Calibration/estimation
“U.S. Firm Sizes are Zipf Distributed,”RL Axtell, Science, 293 (Sept 7, 2001), pp. 1818-20 For empirical PDF, slope ~ -2.06, thus tail CDF has slope ~ -1.06 Pr[S≥si] = 1-F(si) = si-a
“U.S. Firm Sizes are Zipf Distributed,”RL Axtell, Science, 293 (Sept 7, 2001), pp. 1818-20 For empirical PDF, slope ~ -2.06, thus tail CDF has slope ~ -1.06 Average firm size ~ 20 Median ~ 3-4 Mode = 1 Pr[S≥si] = 1-F(si) = si-a
Alternative Notions of Firm Size • Simon: Skewness not sensitive to how firm size is defined • For Compustat, size distributions are robust to variations including revenue, market capitalization and earnings • For Census, receipts are also Zipf-distributed
Alternative Notions of Firm Size • Simon: Skewness not sensitive to how firm size is defined • For Compustat, size distributions are robust to variations including revenue, market capitalization and earnings • For Census, receipts are also Zipf-distributed Firm size in $106
Alternative Notions of Firm Size • Simon: Skewness not sensitive to how firm size is defined • For Compustat, size distributions are robust to variations including revenue, market capitalization and earnings • For Census, receipts are also Zipf-distributed DeVany on the distribution of movie receipts: a ~ 1.25 => the ‘know nothing’ principle Firm size in $106
Self-Employment • 15.5 million businesses with receipts but no employees: • Full-time self-employed • Farms • Other (e.g., part-time secondary employment)
Self-Employment • 15.5 million businesses with receipts but no employees: • Full-time self-employed • Farms • Other (e.g., part-time secondary employment)
What Size is a Typical Firm? Existence of moments depends on a • First moment doesn’t exist if a ≤ 1: a ~ 1.06 • Alternative measures of location: • Geometric mean: s0 a exp(1/a) ~ 2.57(for U.S. firms) • Harmonic mean (E[S-1]-1): s0 a (1+1/a) ~ 1.94(for U.S. firms) • Median: s0 a 21/a ~ 1.92 (for U.S. firms) • Second moment doesn’t exist since a ≤ 2 Moments exist for finite samples Non-existence means non-convergence
History I: Gibrat • Informal sample of French firms in the 1920s • Found firms sizes approximately lognormally distributed • Described ‘law of proportional growth’ process to explain the data • Important problems with this ‘law’ • Early empirical data censored with respect to small firms
History II: Simon and co-authors • Described entry and exit of firms via Yule process (discrete valued random variables • Characterized size distribution for publicly-traded (largest) companies in U.S. and Britain • Pareto tail (large sizes) • Explored serial correlation in growth rates • Famous debate with Mandelbrot • Caustically critiqued conventional theory of the firm
History III: Industrial Organization • Quandt [1966] studied a variety of industries and found no functional form that fit well across all industries • Schmalansee [1988] recapitulated Quandt • 1990s: All discussion of firm size distribution disappears from modern IO texts • Sutton (1990s): game theoretic models leading to ‘bounds of size’ approach to intra-industry size distributions
History IV: Stanley et al. [1995] • Using Compustat data over several years found the lognormal to best fit the data in manufacturing • 11,000+ publicly traded firms • More than 2000 firms report no employees! Ostensibly holding companies • Beginning of Econophysics!
SBA/Census vs Compustat Data • Qualitative structure: increasing numbers of progressively smaller firms • Comparison: 5.5 million U.S. firms
What is the Origin of the Zipf? • Hypothesis 1: Zipf in all industries => Zipf overall
What is the Origin of the Zipf? • Hypothesis 1: Zipf in all industries => Zipf overall Refuted by Quandt [1966]
What is the Origin of the Zipf? • Hypothesis 1: Zipf in all industries => Zipf overall Refuted by Quandt [1966] • Hypothesis 2: Zipf distribution of industry sizes => Zipf overall
What is the Origin of the Zipf? • Hypothesis 1: Zipf in all industries => Zipf overall Refuted by Quandt [1966] • Hypothesis 2: Zipf distribution of industry sizes => Zipf overall No!
What is the Origin of the Zipf? • Hypothesis 1: Zipf in all industries => Zipf overall Refuted by Quandt [1966] • Hypothesis 2: Zipf distribution of industry sizes => Zipf overall No! • Hypothesis 3: Zipf dist. of market sizes
What is the Origin of the Zipf? • Hypothesis 1: Zipf in all industries => Zipf overall Refuted by Quandt [1966] • Hypothesis 2: Zipf distribution of industry sizes => Zipf overall No! • Hypothesis 3: Zipf dist. of market sizes No!
What is the Origin of the Zipf? • Hypothesis 1: Zipf in all industries => Zipf overall Refuted by Quandt [1966] • Hypothesis 2: Zipf distribution of industry sizes => Zipf overall No! • Hypothesis 3: Zipf dist. of market sizes No! • Hypothesis 4: Exponential distribution of firms in each industry and exponential distribution of inverse average firm size
Origin of the Zipf, hypothesis 4 Sutton [1998] gives as a bound an exponential distribution of firm sizes by industry
Origin of the Zipf, hypothesis 4 Sutton [1998] gives as a bound an exponential distribution of firm sizes by industry Exponential distribution of firm sizes by industry: p exp(-ps) Exponential distribution of reciprocal firm means: q exp(-qp)
Origin of the Zipf, hypothesis 4 Sutton [1998] gives as a bound an exponential distribution of firm sizes by industry Exponential distribution of firm sizes by industry: p exp(-ps) Exponential distribution of reciprocal firm means: q exp(-qp)
Origin of the Zipf: Sutton Frequency Average firm size across industries
Firm Growth Rates areLaplace Distributed: Publicly-Traded Stanley, Amaral, Buldyrev, Havlin, Leschhorn, Maass,, Salinger and Stanley, Nature, 379 (1996): 804-6
Properties of Subbotin distribution • Laplace (double exponential) and normal as special cases • Heavy tailed vis-à-vis the normal • Recent work by S Kotz and co-authors characterizes the Laplace as the limit distribution of normalized sums of arbitrarily-distributed random variables having a random number of summands (terms)
Variance in Firm Growth RatesScales Inversely (Declines) with Size s ~ r0-b b ≈ 0.15 ± 0.03 (sales) b ≈ 0.16 ± 0.03 (employees) Stanley, Amaral, Buldyrev, Havlin, Leschhorn, Maass, Salinger and Stanley, Nature, 379 (1996): 804-6
Anomalous Scaling… • Consider a firm made up of divisions: • If the divisions were independent then s would scale like s-1/2 • If the divisions were completely correlated then s would be independent of size (scale like s0) • Reality is interior between these extremes • Stanley et al. get this by coupling divisions • Sutton postulates that division size is a random partition of the overall firm size • Wyart and Bouchaud specify a Pareto distribution of firm sizes
More Firm Facts • Wage rates increase in firm size (Brown and Medoff): • Log(wages) Log(size) • Constant returns to scale at aggregate level (Basu) • More variance in job destruction time series than in job creation (Davis and Haltiwanger) • ‘Stylized’ facts: • Growth rate variance falls with age • Probability of exit falls with age
Requirements of an Empirically Accurate ‘Theory of the Firm’ • Produces a power law distribution of firm sizes • Generates Laplace (double exponential) distribution of growth rates • Yields variance in growth rates that decreases with size according to a power law • Wage-size effect obtains • Constant returns to scale • Methodologically individualist (i.e., written at the agent level) • No microeconomic/game theoretic explanation for any of these
Firm Size Distribution Firm sizes are Pareto distributed, fs(1+a) a ≈ -1.09
Productivity: Output vs. Size Constant returns at the aggregate level despite increasing returns at the local level
Firm Growth Rate Distribution Growth rates Laplace distributed by K-S test Stanley et al [1996]: Growth rates Laplace distributed
Variance in Growth Ratesas a Function of Firm Size slope = -0.174 ± 0.004 Stanley et al. [1996]: Slope ≈ -0.16 ± 0.03 (dubbed 1/6 law)
Wages as a Function of Firm Size:Search Networks Based on Firms Brown and Medoff [1992]: wages size 0.10
Wages as a Function of Firm Size:Search Networks Based on Firms Brown and Medoff [1992]: wages size 0.10
Firm Lifetime Distribution Data on firm lifetimes is complicated by effects of mergers, acquisitions, bankruptcies, buy-outs, and so on Over the past 25 years, ~10% of 5000 largest firms disappear each year
Summary:An Empirically-Oriented Theory • Produces a right-skewed distribution of firm sizes (near Pareto law) • Generates heavy-tailed distribution of growth rates • Yields variance in growth rates that decreases with size according to a power law • Wage-size effect emerges • Constant returns to scale at aggregate level • Methodologically individualist
Background • Agent models are multi-level systems • Empirical relevance can be achieved at different levels • Observation: For most of what we do, 2 levels are active Macro-dynamics g: Rm Rm y(t+1) y(t) a: Rn Rm m < n x(t) x(t+1) f: Rn Rn Micro-dynamics
Update to“Understanding Our Creations…, ”SFI Bulletin, 1994 • Multiple levels of empirical relevance: • Level 0: Micro-level, qualitative agreement • Level 1: Macro-level, qualitative agreement • Level 2: Macro-level, quantitative agreement • Level 3: Micro-level, quantitative agreement • Then, few examples beyond level 0
Distinct Classes of ABMs Qualitative Quantitative Macro Micro
Distinct Classes of ABMs Qualitative Quantitative Macro Micro