Download

1 / 38
400 likes | 571 Vues
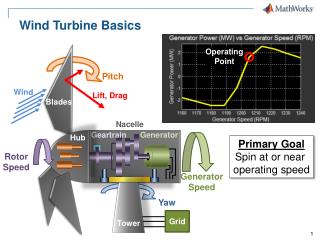
Research Study on Wind Turbine Acoustics DRAFT. March 7, 2014. Interim Results II for WNTAG. Interim Report II. Interim Report II for WNTAG focuses on a comparison of sound metrics with sound modeling to help inform and synchronize pre-construction estimates with post-construction monitoring.

E N D
Research Study on Wind Turbine Acoustics DRAFT March 7, 2014 Interim Results II for WNTAG
Interim Report II Interim Report II for WNTAG focuses on a comparison of sound metrics with sound modeling to help inform and synchronize pre-construction estimates with post-construction monitoring. CONTENTS New terms Review of data collection Sound monitoring metrics Pre-construction sound predictions Attended sound monitoring Statistical confidence
Review of data collection Four sites to date – all in Massachusetts all 1.5 MW or greater Five sound monitoring locations at each site 1/3 octave bands + other metrics at 100 ms to 1 s intervals Type I sound monitors Infrasound monitoring at one location (inside and outside) at one site One LIDAR location at each site One 10-meter met tower at each site Turbine operating conditions collected by operator Over 120,000,000 data records logged Over 150 sound level, meteorological, operational, and observational variables
New terms Site Location Background sound level vs ambient L90 LAf max(1-sec) L90 of the L90
Consideration of new sound monitoring metric for Turbine sound – L90 of Lafmax(1-sec)
Consideration of new sound monitoring metric for Turbine sound – L90 of Lafmax(1-sec)
Consideration of new sound monitoring metric for Turbine sound – L90 of Lafmax(1-sec)
Effect of wind speed on L90 – wind shear Wind Shear Wind shear exponents -0.2 0.3 0.6
Background L90 and Wind Speed are significantly correlated Slopes of 80-meter wind speed vs sound level for various methodologies
Wind speeds vary during any measurement period ws90 1.3 standard deviations Example of a 10-minute period at one site, showing the frequency of occurrence of 0.5 m/s bins for 9 m/s average wind speed
Example of pre-construction modeling methodology for one site 370 meters downwind
Example of pre-construction modeling methodology for one site 370 meters downwind Slope of brown line in db/meter per second
Example of pre-construction modeling methodology for one site 370 meters downwind
Example of pre-construction modeling methodology for one site 370 meters downwind
Example of pre-construction modeling methodology for one site 370 meters downwind
New terms Statistical Bias Accuracy Precision Confidence Interval Standard Deviation Standard Error
Suggested strategy for using different metrics for background and turbine-on measurements
Some specific conclusions from the report Background sound levels vary by time of year, time of day, and day of week. Natural short-term variation is partly a function wind speed and wind shear Sound levels measured on the ground increase when 80 meter wind speed increases Wind shear variation is highest at night and at low wind speeds Background sound will contaminate measurements of wind turbine sound Wind alone can have a significant effect By definition, 90% of the turbine-on measurements have background levels that are higher than the L90 When measuring over five or 10 minutes, the wind speed exceeded 90 percent of the time is likely to be at a lower integer wind speed than the mean wind speed
More specific conclusions from the report Since L90 and wind speed are correlated, this means that the L90 is also likely to occur at a lower wind speed relative to the mean. Adjustments can be made to account for this. The 10th percentile wind speed is a function of the mean and standard deviation of the measured wind speed over a period Considerations of sound metrics Using L90 of Lafmax (1-sec) for both background and turbine-on measurements Improving predictability by establishing a turbine-only sound limit based on background measurements during pre-construction Incorporating some type of statistical analysis to improve confidence in compliance measurement Adjust turbine-on sound metric (if different from background metric) to account for higher background sound.
General conclusions Overall, real-world systems are dynamic. Methods developed should take into account likelihood that Conditions change during the measurement Conditions change over time Measurements including everything that produces sound in the environment Methods to measure and model sound will have biases Methods to measure and model sound will have variability
Contact Kenneth Kaliski, P.E., INCE Bd. Cert. Senior Director Ken.kaliski@rsginc.com 802-295-4999 www.rsginc.com