Download

1 / 47
480 likes | 659 Vues
EGU2012-12951 Updating of states in operational hydrological models. Oddbjørn Bruland ( Statkraft Energy) S. Kolberg, K. Engeland, L. Tøfte (SINTEF) A. S. Gragne and K. Alfredsen (Norwegian University of Technology and Science) G. Liston (University of Colorado). Statkraft….

E N D
EGU2012-12951Updatingofstates in operationalhydrologicalmodels Oddbjørn Bruland (Statkraft Energy) S. Kolberg, K. Engeland, L. Tøfte(SINTEF) A. S. Gragne and K. Alfredsen (Norwegian University of Technology and Science) G. Liston (University of Colorado)
Statkraft…. … a European leaderin renewableenergy EGU 2012
Hydropower and Hydrology How important is hydrology to a hydropower producer?
NO1 Importance…. 64 HBV-models within the NO1 area
Precipitation data 98 Precipitation gauges withinthe NO1 area - provide input to theHBV-models
Precipitation at Vågsli; summer 2008 • 130% of normal precipitation • is input to 18 HBV-models • Surrounding gauges showed 80-90% ofnormal
14000 GWh Snowstorage NO1Week 36/2007 – 16/2008 (as simulated by HBV models) 3000 GWh Snow surveys
How did we act? Forecast: • Veryhigh risk offlooding
How did we act? Forecast: • Veryhigh risk offlooding • Priceforecastsindicatedprice=0
How did we act? Forecast: • Veryhigh risk offlooding • Priceforecastsindicatedprice=0 => Highproduction at lowprices to reduce risk offlooding
Summary – economical Spill from reservoir Estimated loss ofincome: ≈ 270 mill NOK (i.e. 45 mUSD or 30 mEUR)
… in Statkraft alone.. Observations and Met Forecasts Establishedmodels for hydrologicalstate and forecasting
Hydropower and Hydrology • How do the Hydropower companies apply hydrological information? • For short term production planning • Optimizing use of water at the horizon of 5 to 10 days • Daily updating and replanning
Hydropower and Hydrology • How do the Hydropower companies apply hydrological information? • For short term production planning • Optimizing use of water at the horizon of 5 to 10 days • Daily updating and replanning • For Long term planning of water disposal • Optimizing the use of water at a seasonal horizon • Weekly updating and replanning
Short vs Long Term planning • Short term • Profile and timing is more importantthanvolume
Short vs Long Term planning • Long term • Volume is more importantthanprofile and timing
Short vs Long Term planning • Short term • Profile and timing is more importantthanvolume • Long term • Volume is more importantthanprofile and timing DifferentUpdatingapproach
Updating for Short term forecast • Timing, level and tendency in focus • Short time storages must be right
Updating for Long term forecast • Volume and duration in focus • Snowstorage is important, relative to normal • Climateadjustedclimatology
How do weapproachtheseissues side 27 Fordelt hydrologisk modell • The project was established in 2009 as a cooperation between all larger hydropower producers in Norway, SINTEF, NTNU, Powel and Liston and the Norwegian Research Council.With the goal to develop, improve and implement model updating methods and techniques in operational models
Project Outline • Developing and implementing updating methods based on available sources of information • Runoff, snow cover, snow measurements • Combined with • Observation uncertainty • Model uncertainty • And a combination of these ”An opensourcedistributedmodel system” ENKI
Whatis done… Usingsnowdistributionmodelcombinedwithsnowobservations – Liston UsingBayesianstatisticsweighingmodelstateagainstsateliteobservation - Sintef Usingparticlefiltering to benefit from recentinformation – Sintef Usingerrordetection to detect and explain and correctthemodel in spesificsituations - NTNU EGU 2012
Snowstorageupdating 1 Data averaged over the snow observation mask. Precipitation correction factor ~ 0.75. 614 mm SWE on 21 April 2008 • Liston’s SnowTran3D snowdistributionmodel is implemented in themodel system • Usinginformation from snowcourses to updatesnowdistribution in simulatedsnowdistribution from Listonsmodel
Snowstorageupdating 2 Based on modeled snowdistribution, an predefined (apriori) snowdepletion curve, modelled snow melt progress and snow cover information from satelite images Methodology based on Bayesian statistics by Sjur Kolberg, SINTEF, has shown promising results and is a candidate for implementation in the model system.
1.5 0 0 250 500 0.5 1 1 0.8 0.6 0.4 0.2 0 0 200 400 600 800 1000 0 0.2 0.4 0 200 400 • Snowstorageupdating 2 BayesianupdatingoftheSnowDepletionCurve E[m] SD[m] E[cv] SD[cv] E [ ] m,cv,y0,λ Prior Posterior E[λ] SD[λ] E[y0] SD[y0] (Sjur Kolberg, 2010)
Snowstorageupdating 2 • More images improvestheestimateof (m, cv, y0, {λ(t)}) • ieuncertaintydecreases as snowcoverdepletes • Calibrationbasedonpreviousyearsalsoimprovesestimates • R2 from 0.63 - 0.68 (average for 22 catchmentsusing same parametersets)
Snowstorageupdating 2 • More images improvestheestimateof (m, cv, y0, {λ(t)}) • ieuncertaintydecreases as snowcoverdepletes • Calibrationbasedonpreviousyearsalsoimprovesestimates • R2 from 0.63 - 0.68 (average for 22 catchmentsusing same parametersets)
Snowstorageupdating 3 • Earlysnowfallsare sensitive to thresholdtemperatures for snow – rain, and melt – freeze. • Wrongvaluesgivessimulated ≠ observedtwice as boththeaccumulation and timing ofmeltinggetwrong
Snowstorageupdating 3 Developmethodology for classificationofhydrographserror Developemethodology for modelupdatingbasedontheseevents. Defined as a mainsubject in PhD
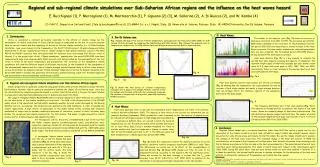
(a) amplitude errors (b) phase errors (c) shape errors Figure 2: Definition of types of error between measured (—) and simulated (---) hydrographs [Source: adopted from Serban and Askew (1991)] Description of simulation errors
Algorithm for categorization of errors Qsim=m*Qobs+q
Preliminary results Error groups identified (overestimation, exact and underestimated). • Data: hourly simulation of Votna hydropower plant; hydrologic year 1999. • Mismatches totally compounded to 195 local errors; 51 significant.
Parameter uncertainty • Parameter uncertainty used in modelupdatingapproaches • Autocalibrationgives a huge numberof parameter setsthatobjectivelyareequallygood (R2 and waterbalance) • Butbehavesignificantlydifferent for the same event • For forecasting purpose themodel best adapted to theactualsituation is assumed to givethe best forecast • DYNIA and DREAM arecalibrationroutines relevant for this purpose
DYNIA k2 k0 k1 k0 Q=f(k0,k1,k2,h) • DynamicIdentifiabilityAnalysis (Wagener et. al. 2003) • Applied to a catchment in soutwestnorway • TX (snow/rainthreshold) • – highsensitivityexcept from July-Oct, twopreferredvalue ranges • K0 , K1 and K2 had all twopreferredvalue ranges
DREAM • Dream(Vrugt et al, 2008) is a MarkovChain Monte Carlo (MCMC) optimizingalgorithmthatsuitsthe purpose ofdetectingthemodelsensitivity to each parameters value-range • Gives parameters uncertainty/influence • Thus alsowhich parameters to test in an updatingsequence • Givesaprioridistributionof parameters for a calibrated region • Ensemble ofmodels used for weightedupdating
From Dream to ParticleFiltering • Dreamgives a ensemble ofmodelswithequallikelihood • Butalsoheavilyautocorrolated (results) • And thus a challange to extractsignificantinformation • A likelihoodfunctionwas used to extractthosegivingsignificantinformation and thusreducethenumberofobservations.
ParticleFiltering Apriori for parameters Filter(Runoff, windowsize, weigth) Particles Re-weigthed particles Uncertain input(P,T)
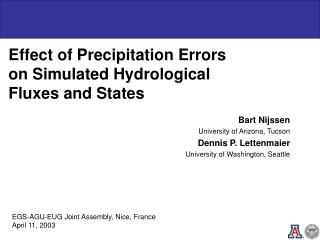
ParticleFiltering • Filteredrunoff – 95% confidenceinterval
ParticleFiltering • Resultats – filteringonsnow
FurtherWork • Improve local optimization by allowing parameters to vary over the domain • And still ensure consistent behavior • Develop methodology to find and use the criteria for the variability • A new response routine is developed/tested • in order to both simplify calibration • to reduce model complexity • to get more significant correlation parameters/topography • improve updating
Contact info • SINTEF • Sjur Kolberg : sjur.kolberg@sintef.no • Kolbjørn Engeland: Kolbjorn.Engeland@sintef.no • Lena Tøfte: Lena.S.Tofte@sintef.no • NTNU • Ashenafi Seifu Gragne: ashenafi.gragne@ntnu.no