Plotting and spatial data
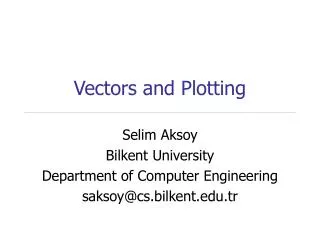
Plotting and spatial data. Brody Sandel. Plotting. For creating a plot plot() hist() For drawing on a plot points() segments() polygons() For controlling how plots look par() Make a new plotting window x11() (PC), quartz() (Mac). plot(). x = 1:10 y = 10:1 plot( x,y ). plot().

Plotting and spatial data
E N D
Presentation Transcript
Plotting and spatial data Brody Sandel
Plotting • For creating a plot • plot() • hist() • For drawing on a plot • points() • segments() • polygons() • For controlling how plots look • par() • Make a new plotting window • x11() (PC), quartz() (Mac)
plot() x = 1:10y = 10:1plot(x,y)
plot() x = 1:10y = 10:1plot(x,y,main = “A plot”,xlab = “Temperature”, ylab = “Pirates”)
type = “l” “b” ”h” “o” “s”
type = “l” “b” ”h” “o” “s”
Plotting size and characters cex = 2 or cex = 3
Plotting size and characters pch = A, cex = 3 pch = A, cex = x pch = 10, cex = 3
Color • By name • “blue” or “dark grey” . . . • By function • grey() • rainbow() • rgb()
Color x = rep(1:10,10) y = rep(1:10,each=10) plot(x,y)
Color x = rep(1:10,10) y = rep(1:10,each=10) plot(x,y,pch = 15,cex = 2)
Color x = rep(1:10,10) y = rep(1:10,each=10) plot(x,y,pch = 15,cex = 2,col = “dark green”)
Color x = rep(1:10,10) y = rep(1:10,each=10) plot(x,y,pch = 15,cex = 2,col = rgb(0.8,0.1,0.2))
Color x = rep(1:10,10) y = rep(1:10,each=10) plot(x,y,pch = 15,cex = 2,col = rgb(seq(0,1,by = 0.01),0.1,0.2))
Drawing on plots • points(x,y) adds points to existing plots (with very similar options to plot()) • segments(x0,y0,x1,y1) draws lines from points to other points • polygons()
The wonderful world of par() • 70 different options to control your plots!
Plotting to a file • pdf(), bmp() • dev.off()
Some examples All created entirely within R!
Some fun stuff • googleVis is a package that lets you use plot data on a google map (online, and therefore interactive)
Some fun stuff • rgl lets you plot 3d surfaces and render them in real time • Demo!
Geographic data in R • Data types • Vector • Raster • Packages • maptools • raster
Package maptools • readShapePoly() reads in a GIS shape file • Can be plotted • Various functions for converting among formats • Merge polygons
Package raster • the raster package has everything you need for handling rasters • Read, write, plot, all kinds of queries and manipulations
What is a shapefile? • The spatial information • Associated attributes
What is a shapefile? • The spatial information • Associated attributes az@polygons[[1]]@Polygons[[1]]@coords [,1] [,2] [1,] -110.5393 37.00423 [2,] -110.4799 37.00393 [3,] -110.4788 37.00393 [4,] -110.4719 36.99958 [5,] -110.4610 36.99957 [6,] -110.3273 36.99947
What is a shapefile? • plot(az@polygons[[1]]@Polygons[[1]]@coords)
What is a shapefile? • Associated attributes • Depend on your file • Might include names, lengths, areas etc. • Use str(object_name) to find out what you have
Contents of a SpatialPolygonsDataFrame > str(az) Formal class 'SpatialPolygonsDataFrame' [package "sp"] with 5 slots ..@ data :'data.frame': 1 obs. of 16 variables: .. ..$ ID_0 : int 234 .. ..$ ISO : Factor w/ 1 level "USA": 1 .. ..$ NAME_0 : Factor w/ 1 level "United States": 1 .. ..$ ID_1 : int 3193 .. ..$ NAME_1 : Factor w/ 51 levels "Alabama","Alaska",..: 3 .. ..$ VARNAME_1 : Factor w/ 51 levels "AK|Alaska","AL|Ala.",..: 4 .. ..$ NL_NAME_1 : Factor w/ 0 levels: NA .. ..$ HASC_1 : Factor w/ 51 levels "US.AK","US.AL",..: 4 .. ..$ CC_1 : Factor w/ 0 levels: NA .. ..$ TYPE_1 : Factor w/ 2 levels "Federal District",..: 2 .. ..$ ENGTYPE_1 : Factor w/ 2 levels "Federal District",..: 2 .. ..$ VALIDFR_1 : Factor w/ 35 levels "17710304","17760704",..: 30 .. ..$ VALIDTO_1 : Factor w/ 1 level "Present": 1 .. ..$ REMARKS_1 : Factor w/ 0 levels: NA .. ..$ Shape_Leng: num 23.8 .. ..$ Shape_Area: num28.9
..@ polygons :List of 1 .. ..$ :Formal class 'Polygons' [package "sp"] with 5 slots .. .. .. ..@ Polygons :List of 1 .. .. .. .. ..$ :Formal class 'Polygon' [package "sp"] with 5 slots .. .. .. .. .. .. ..@ labpt : num [1:2] -111.7 34.3 .. .. .. .. .. .. ..@ area : num 28.9 .. .. .. .. .. .. ..@ hole : logi FALSE .. .. .. .. .. .. ..@ ringDir: int 1 .. .. .. .. .. .. ..@ coords : num [1:1655, 1:2] -111 -110 -110 -110 -110 ... .. .. .. ..@ plotOrder: int 1 .. .. .. ..@ labpt : num [1:2] -111.7 34.3 .. .. .. ..@ ID : chr "2" .. .. .. ..@ area : num 28.9 ..@ plotOrder : int 1 ..@ bbox : num [1:2, 1:2] -114.8 31.3 -109 37 .. ..- attr(*, "dimnames")=List of 2 .. .. ..$ : chr [1:2] "x" "y" .. .. ..$ : chr [1:2] "min" "max" ..@ proj4string:Formal class 'CRS' [package "sp"] with 1 slots .. .. ..@ projargs: chr " +proj=longlat +datum=NAD27 +ellps=clrk66 +nadgrids=@conus,@alaska,@ntv2_0.gsb,@ntv1_can.dat" plot(az@polygons[[1]]@Polygons[[1]]@coords)
What is a raster? • A raster is a pixel-based (grid) format with spatial information
What is a raster? • A raster is a pixel-based (grid) format with spatial information
What is a raster? • A raster is a pixel-based (grid) format with spatial information Extent
What is a raster? • A raster is a pixel-based (grid) format with spatial information Resolution Extent
What is a raster? • A raster is a pixel-based (grid) format with spatial information Origin Resolution Extent
What is a raster? • A raster is a pixel-based (grid) format with spatial information Origin Projection, datum Resolution Extent
What is a raster object? • An R raster object contains • A vector of values • A size (nrow, ncol) • Spatial information (extent, projection, datum) • A raster can have some of these things missing (for example, no data values, or no projection)
What is a raster object? > mat = raster(“MAT.tif”) > mat class : RasterLayer dimensions : 2882, 2880, 8300160 (nrow, ncol, ncell) resolution : 0.004166667, 0.004166667 (x, y) extent : 0, 12, 48, 60.00833 (xmin, xmax, ymin, ymax) projection : +proj=longlat +ellps=WGS84 +datum=WGS84 +no_defs +towgs84=0,0,0 values : C:/Users/brody/Documents/Teaching/R for Macroecology/Week 4/MAT.tif min : ? max : ? Where’s the data?
Raster objects are different! • Normal objects are stored in memory, for fast access • Raster objects are not always • When you define a raster object R looks at the summary information and remembers the hard drive locations • Small rasters often do reside in memory • Advantages and disadvantages
The structure of a raster object • Stored as a big vector ncol = 8 1 2 3 4 5 6 7 8 9 . . . . n 1 2 3 4 5 6 7 8 9 . . . . . . . . . . . . . . . . . . . . . . . . . . . . . . . n
Create a new raster > newRaster = raster(nrows = 10,ncols = 6,xmn = 0,xmx = 6,ymn = 50,ymx = 60,crs = "+proj=longlat +datum=WGS84") > newRaster class : RasterLayer dimensions : 10, 6, 60 (nrow, ncol, ncell) resolution : 1, 1 (x, y) extent : 0, 6, 50, 60 (xmin, xmax, ymin, ymax) projection : +proj=longlat +datum=WGS84 +ellps=WGS84 +towgs84=0,0,0 values : none
Create a new raster > newRaster = setValues(newRaster,1:60) > plot(newRaster)
Getting values from a raster > newRaster[22] [1] 22 > newRaster[2,4] [1] 10 > getValues(newRaster)[12] [1] 12
Plotting a raster • plot() • xlim and ylim control plotting window (just like usual) • col specifies the color palette (this works a bit differently) • subsample (defaults to TRUE) determines whether or not to plot every pixel (if TRUE, only plots at most maxpixel pixels) • colors • rbg(), rainbow(), heat.colors(), terrain.colors(), topo.colors() • I also like the colors in fBasics package • Can also use image() • Similar, but no scale bar
Plotting examples plot(newRaster,col = rgb(seq(0,1,0.2),0.5,0.5)) plot(newRaster,maxpixels = 7) plot(newRaster,xlim = c(2,5),ylim = c(52,59),col = rainbow(50))
A few useful ways to explore rasters • zoom() • Opens a new active plotting window with the selected region • click() • Queries a value, if xy = TRUE, also returns the x and y coordinates
Polygon -> Raster • rasterize(polygon, raster)
Polygon -> Raster • rasterize(polygon, raster)
Polygon -> Raster • rasterize(polygon, raster)
What is a projection? • A representation of the spherical world on the plane • They always produce some distortion (of shape, area or direction) • Projection, datum, ellipse • Projection describes how the spherical coordinates are flattened • Datum describes how the Earth ellipsoid is modeled • projInfo(“proj”) and projInfo(“datum”) show you the options available • More info here: • http://www.remotesensing.org/geotiff/proj_list/