Download

1 / 24
240 likes | 409 Vues
Accurate estimation of microbial communities using 16S tags. Julien Tremblay, PhD jtremblay@lbl.gov. 16S rRNA as phylogenetic marker gene. 21 proteins. 16S rRNA. 30S. 70S Ribosome. subunits. 50S. 5S rRNA. Escherichia coli 16S rRNA Primary and Secondary Structure. 34 proteins.

E N D
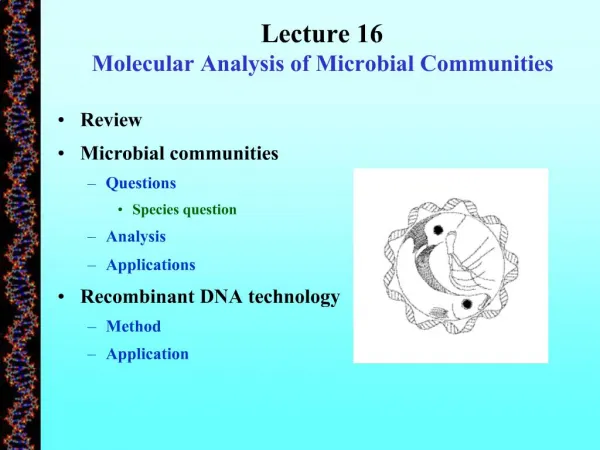
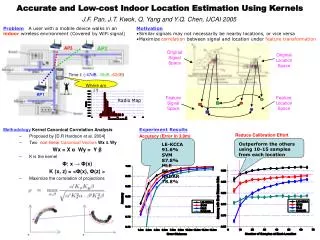
Accurate estimation of microbial communities using 16S tags Julien Tremblay, PhD jtremblay@lbl.gov
16S rRNA as phylogenetic marker gene 21 proteins 16S rRNA 30S 70S Ribosome subunits 50S 5S rRNA Escherichia coli 16S rRNA Primary and Secondary Structure 34 proteins 23S rRNA highly conserved between different species of bacteria and archaea Falk Warnecke
16S rRNA in environmental microbiology(Sanger clone libraries) 900-1100 bp length Falk Warnecke
Next generation sequencing (NGS) 454 Illumina 0.5M 450bp reads $$ 10-350M 150bp reads/lane $ Read length Throughput and cost
Illumina tags (itags) ~400 bp ACGTGGTACTACGTGAT…. ~250 bp ACGTGGTACTACGTGATAGTGTAT 454 Illumina • 454 = “1” read • Illumina = “2” reads => have to be assembled • Both reads need to be of good quality
Game plan to survey microbial diversity V1 V2 V3 V4 V5 V6 V7 V8 V9 16S rRNA Generate amplicons of a given variable region from bacterial community (many millions of sequences) Why amplicon tags ? Deeper, cheaper, faster X 10 X 1 X 1,000 X 2,000 Identification (BLAST, RDP classifier) Reduce dataset by dereplication/clustering X 200 X 1,200 X 800 X 10,000
Rare biosphere High sequencing depth of NGS reveals “rare” OTUs Lots of reads only present once in sample… Abundance Rare biosphere Rank Low abundance High abundance Sequencing error? Chimeras? Background noise?
Rare bias sphere? 27F 342R 1114F 1392R Is rare biosphere an artifact of the NGS error? Control experiment: estimate rare biosphere in a single strain of E.coli V1 & V2 V8 Should not be a sequencing artifact, if relatively stringent clustering parameters are applied Subject to controversy – Is rare always real? Kunin et al., (2009), Environ. Microbiol. Quince et al., (2009), Nat. Methods
Illumina tags (itags) • Typical 454 run 450,000 – 500,000 reads • “Typical” Illumina run: • GAIIx 10,000,000 – 40,000,000 reads/lane • Hiseq ~ 350,000,000 reads/lane • Miseq (new) ~8,000,000 reads/lane • Move 16S tags sequencing to Illumina platform • HiSeq = huge output compared to 454 (suitable for big projects 1000+ indexes(barcodes)/libraries • MiSeq = moderatly high throughput (More suitable) • throughput more efficient clustering algorithm (SeqObs).
16S tags clustering Edward Kirton, JGI
Number of reads >> number of clusters 30 25 20 15 Number of reads (millions) 10 Clustering happens here! ~100,000 clusters 5 0 Edward Kirton, JGI
Validation of 16S tags on MiSeq MiSeq reads 1 and 2 separately 454 • Quality is superior in MiSeq MiSeq reads 1 and 2 assembled
MiSeq validation • Exploratory experiments using 11 wetlands samples. • Validate reproducibility between runs
MiSeq validation • Beta diversity (UniFrac Distances) Run 1 Run 2
MiSeq validation • What are the gains using MiSeq assembled paired-end reads over 454 reads? • Average bootstrap value for all clusters at every tax level. 454 clusters shows higher confidence than MiSeq clusters Better quality in MiSeq reads, but lower read lengths Average bootstrap value Taxonomic level
Comparing 454 with MiSeq • What are the gains using MiSeq assembled paired-end reads over 454? Clusters having > 0.50 bootstrap value For instance, ~310,000 reads made it to the class level MiSeq outperforms 454 in terms of read depth
itags – rare OTUs Low abundant reads consistently shows low confidence in Classification. Low abundant reads = errors, artifacts? Low abundant reads are underrepresented in databases? MiSeq wetlands test samples
Comparing 454 with illumina • Compare runs of 454 and MiSeq of same sample • Although challenge to compare V4 with V6-8 region. 515 806 926 1392 ~466 bp ~291 bp
Comparing 454 with illumina • Primer pair of variable region is likely to affect outcome of results. In silico PCR on 16S Greengenes database.
PyroTagger (for 454 amplicons) Unzip, validate Remove low-quality reads Redundancy removal PyroClust & Uclust Remove chimeras Samples comparison, post-processing pyrotagger.jgi-psf.org
Classification and barcode separation • Sequences of cluster (OTU) representatives • Blast vs GreenGenes and Silva databases, dereplicated at 99.5% • Distribution of microbial phyla in the dataset • Also see the Qiime pipeline
Challenges • Short size of amplicon • What filtering parameters to use (stringency level)? • balance between stringency filter and keeping as much data as we can • Whole new dimension for rare biosphere? • Handling large numbers of sample (tens of thousand magnitude) • Sequencing run is fast, but library preparation time is long. • Cost of barcoded primers (will need lots of barcodes), handling. • Huge ammount of samples statistics models…
Acknowledgments • Susannah Tringe • Edward Kirton • Feng Chen • Kanwar Singh • Alison Fern • And many others! Thanks!
16S rRNA Dangl lab, UNC