Download
1 / 22
220 likes | 322 Vues
Lewis and Clark County Water Quality Protection District. 316 North Park, Room 220 Helena, MT 59623 (406) 447-8585 Fax: (406) 447-8398. Nitrate Distribution, Fate and Transport in Helena Area Waters. James Swierc, PG Lewis & Clark Water Quality Protection District

E N D
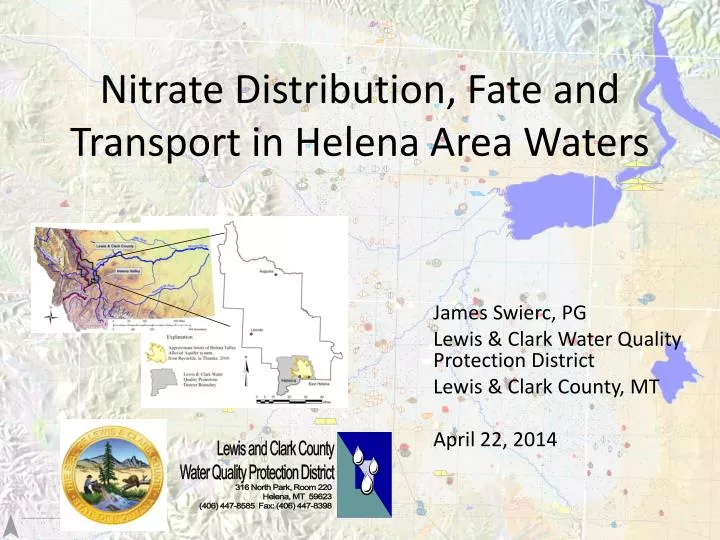
Lewis and Clark County Water Quality Protection District 316 North Park, Room 220 Helena, MT 59623 (406) 447-8585 Fax: (406) 447-8398 Nitrate Distribution, Fate and Transport in Helena Area Waters James Swierc, PG Lewis & Clark Water Quality Protection District Lewis & Clark County, MT April 22, 2014
Background • Helena Valley – SW Montana • “Typical” Western Montana Valley • Alluvial Aquifer in Valley bounded by Bedrock/Tertiary Basin Fill • River/Stream – Aquifer connections • Losing Streams at Upgradient Valley Margins • Gaining Streams at Downgradient Margins • Irrigation Canals • Local Water Issues – Nitrate Related • Ground (Drinking) Water Quality • Public Water Supplies vs Private Wells • Wastewater treatment/management • Sewered Areas vs Septic Systems • Concerns over Nitrate Contamination • USGS Studies 1973, 1980, 1992, 2000 • County – Septic Maintenance District • Recent Studies: TMDL 319, MBMG • Water Quality Map (Major Ion Types) • Isotopes (Nitrogen & Oxygen of Nitrate) • Drain Assessment & Cl/Br Ratios
Nitrate in Ground Water • LCWQPD Monitoring Well Data (2009-2012) • Residential Areas with Reported Problems (limited data) • “Background” • Streams • Recharge Areas < 1 mg/L • Ground Water • Undefined, < 2 mg/L • Sources? • Agriculture vsSeptics • Differentiation Methods • Nitrate Isotopes • Cl/Br Ratios
Conceptual System Model Helena Valley Hydrogeology Recharge to Aquifer from Precipitation • Aquifer - Unconsolidated Alluvium • Clay lenses towards central valley • Vertical upward gradient • Ground Water Flow • Shallow - Towards Lake Helena • Unconfined at valley margins • Upwelling in central valley • Artesian flowing wells • Vertical Upward Gradient • Gaining streams in central valley • Recharge • Stream loss at valley margins • precipitation, irrigation loss • Bedrock Aquifer discharge in subsurface to Alluvial Aquifer • Helena Valley Irrigation Canal • Missouri River Water into Basin • Distribution Laterals/Drains • Lake Helena • Discharge point for surface and ground water Recharge to Aquifer from Stream Loss Recharge from Irrigation Waters 546 Water Surface Map from Briar & Madison (1992)
Nitrate Isotopes • Nitrate Isotopes • Nitrogen • Oxygen • Tracking Nitrate Recharge Sources • Denitrification Pathway • “Lighter” atoms denitrify first • Microbially mediated From Kendall (1998) All Helena Area Nitrate Isotope Data
Nitrate Isotope Sampling Locations • Datasets • USGS, 2000 (Not Shown) • Bedrock Locations • MBMG GWIP Studies (2011) • LCWQPD Studies (2011, 2012)
Nitrate Isotope Sampling Results • Datasets • LCWQPD Studies (2011, 2012) • No long decay series…
Nitrate Isotope Sampling Results • Sources • “Old” Problem near Helena; Fairgrounds • Fertilizer in Central Valley • Remaining Data “clustered”
Chloride/Bromide Ratio • Cl/Br ratio – premise, Cl from anthropogenic uses discharged to septic system drainfield • Bromine stable/constant for “background” • Increase in nitrates associated with increase in chloride • Nitrate can degrade, leaving elevated chloride • Problem for Helena Valley – different recharge sources/ hydrologic areas
Ground Water Cl/Br Results • Poor Correlation at Valley Scale • Inconclusive Results • Look at Drains
Drain System – Central Valley • Irrigation System • Main HVID Canal • Distribution Laterals • Ditches/Return Flow Laterals • Tile Drains • Samples Ground Water from top of water table
Drain Data – West Valley • D2-4 • Drains Residential and Agricultural Areas • Nitrate decreases in summer, increase after irrigation season • Cl/Br Ratio varies, 164-500
Drain Data – Southwest • D3-2 • Drains Residential and Agricultural Areas • Nitrate “stable” • Cl/Br Ratio varies, 205-517
Drain Data – Northwest • D2.2-1 • Drains Residential and Agricultural Areas • Nitrate increases in summer • Cl/Br Ratio varies, 182-420 • D2.2-5 • Drains Agriculture Area • Nitrate increases post-irrigation • Cl/Br Ratio varies, 111-535
Drain Data – North • D1-1 • Drains Residential and Agricultural Areas • Nitrate increases in summer • Cl/Br Ratio varies, 146-543 • D0-1 • Drains Agriculture Area • Nitrate increases post-irrigation • Cl/Br Ratio varies, 170-792
Drain Data – East Valley • D7-1 • Drains Primarily Agricultural Areas • Nitrate low, “stable” • Cl/Br Ratio varies, 145-375
Drain Data – Observations • Nitrates • Some Variability pre/post irrigation season • Chloride / Bromide • Chloride – generally stable • Bromide – widely variable • Low/Trace Levels – Lab quantification issues • Different Sources for Br • Need to characterize recharge sources as baseline for comparison
Chloride (& Bromide) Sources? • From De-icing Solutions for Roads (MgCl, NaCl, etc.) • Highest Chloride concentrations adjacent to roads • From Fertilizers? • Saffigna & Keeney, 1977 Ground Water, V. 15, No. 2 • Wisconsin Agricultural Areas, NO3/CL Ratio constant • Noted FERTILIZERs as source for Nitrate & Chloride • Potassium Chloride used for Potassium source • See Nitrate-Chloride Linear Relationship at valley residential wells with Nitrate Problems, by agricultural fields
Fate & TransportVertical Upward Gradient • East Helena area well cluster (trio) • Well 1, TD 103’ • Well 2, TD 128’ • Well 3, TD 169’ • 4 feet vertical head upward over 60 feet
Horizontal vs Vertical flow rates • Vertical gradient order of magnitude higher than horizontal gradient • Hydrograph shows similar response pattern so affected by same surficial recharge sources • Deep water recharge source, vertical flow retarded by finer-grained layers • Result – keeps surface contaminants near surface, even if drawn down by well pumping High K flowpath Lower K Aquitard High K flowpath Gradients are real, aquifer hydraulic properties are estimated to illustrate concept
Fate and Transport Summary • Nitrates released to top of aquifer from surface • Fertilizer AND Septic System sources • Central Valley – area near Drains • Denitrification occurs, low Nitrate and low dissolved oxygen levels in shallow wells • Drains flush top of water table into ditches • Vertical upward gradient • Dilution of nitrate waters • High Chloride, Low NO3 • Denitrification, dilution • Added chloride What does clustering of Isotope data here mean? Mixing of different sources? Rapid Denitrification?
Questions/Discussion? Note – work is ongoing, drain study continues through 2014 James Swierc, PG jswierc@lccountymt.gov • Project Report(s), Poster(s) and more information available at • http://www.lccountymt.gov/health/water.html Helena Valley from Divide (view East)