Florida Citrus Inventory Modernization Project
Florida Citrus Inventory Modernization Project. Building a GIS of Florida’s Commercial Citrus Groves. Claire G. Boryan, Geographer United States Department of Agriculture National Agricultural Statistics Service Research and Development Division. Presentation Overview.

Florida Citrus Inventory Modernization Project
E N D
Presentation Transcript
Florida Citrus Inventory Modernization Project Building a GIS of Florida’s Commercial Citrus Groves Claire G. Boryan, Geographer United States Department of Agriculture National Agricultural Statistics Service Research and Development Division
Presentation Overview • Florida citrus industry facts • Citrus inventory program • Pre-GIS methodology • Reasons to adopt a GIS • Digitizing methodology • Automated Change Detection • Florida Cropland Data Layer
NASS Field Office Locations Florida Field Office, Orlando
Florida citrus industry facts • 750,000 acres (1170 sq. miles, 304,000 hectares)* • 80% oranges, 10% grapefruits, 10% specialty* • Leading producer in world of grapefruits** • Second, to Brazil, in orange production** • 90% canned, chilled, or concentrated** • 80% of U.S. supply** • $9.13 Billion industry** • 89,700 jobs** *NASS/FFO 2004 **UF/IFAS 2000
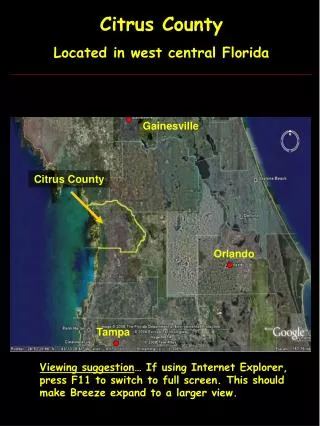
Map Distribution of Commercial Citrus in Florida, 2004
Florida Agriculture Statistics Service Citrus Program • Census of commercial citrus tree inventory published every 2 years
Past census methodology Aerial film-based imagery flown biennially
Imagery was photo interpreted manually to determine groves • that had changed since last census.
Field survey crews dispatched to the areas to assess and record any changes • Tree counts • Variety, Year, Spacing • if new planting
Example survey “ozalid” style map showing hand drawn grove and section boundaries and labeled with basic record information
Drawbacks of past system • Over 1000 hand-drawn maps must be reworked each survey cycle • Labor intensive • Time consuming • Limited spatial analysis capabilities • Difficult to use ancillary GIS information that is already available • Digital aerial photography • GPS data • Related GIS sources • Roads • Land-cover • Tax parcels • Etc….
Benefits of the GIS-based citrus census • More efficient • Lower cost • …in the long run • Increased analytical ability • Spatial-based queries/summaries • Other GIS capabilities • Tracking disease (canker, greening) • Hurricane analysis (overlay tracks) • Land cover conversion (urbanization) • Cartographic capabilities • Eliminates manual polygon and label redrawing • Customizable and consistent map layouts
GIS data capture methodology • Using ESRI ArcGIS as software platform • Industry standard • Large user community • USDA has site-wide license • Gathered existing digital data • Georeferenced 2004 aerial 1 meter resolution imagery (DOQQs) from Florida Department of Environmental Protection • Ancillary information sets including the PLSS grid, county boundaries, roads, infrastructure etc. • FASS tabular tree census database • SAS based • Gathered existing analog data: • FASS map sheets
Grove boundary creation • Digitizing of 2004 grove layer within ArcGIS • Used 2004 DOQQ imagery for spatial reference • Used 2004 hand drawn maps as grove boundary ground truth • Utilizing ESRI’s Shapefile GIS data format for initial digitizing of polygons • Process involved heads-up digitizing technique • Included editing of block numbers within feature attribute table • Drawing precision was specified at 3 meters, or 1:4000 scale
Digitizing comments • Digitizing was relatively slow • Started in early 2005, nearly 100% was complete a year later • Many people with a range of computing skill levels helped with the digitizing effort. • A challenge to train • A challenge to manage • Most were not familiar with concepts of a GIS • Most had never used ArcGIS before
Florida Commercial Citrus Inventory GIS40,000 commercial groves were digitized with records for nearly 130,000 plantings Screen capture of ArcMap in action
Map sheet example Each Map sheet contains 9 sq. mile sections. Over 1000 unique map sheets created, based on quadrants of the Public Land Survey System (PLSS) in 1:8000 scale.
Some statistics • Approximately 40,000 commercial groves were digitized • The groves contain records for nearly 130,000 plantings • Over 1000 unique map sheets created • Based on quadrants of the Public Land Survey System Townships • 1:8000 scale • Each contain 9 square mile sections • 1 year was needed to digitize and compile everything • With several staff members working full or part-time on the project
The future • The NASS Florida Field Office now has a dedicated GIS infrastructure • A pioneering group within NASS! • Likely to become a model for other NASS state offices • Perhaps for inventorying other Fruits, Nuts, Berries….
Citrus grove change detection Citrus Groves 1999 Citrus Groves 2004 Critical to monitoring of production inventory Large volume of data & manual process Labor intensive and inefficient -- Automation required
Automated citrus grove change detection Citrus Groves 2004 Change Detection Results Decrease in vegetation Increase in vegetation No change
Related research work • Imagery exploitation • Satellite versus aerial • Availability • Cost/benefit • Information extraction • Tree counting • Change detection • Mobile/field GIS applications • GPS receivers • PDA/Tablet PCs • Citrus land-cover classification (within Cropland Data Layer program)
Related research work • Florida 2004 Cropland Data
Thanks • NASS • www.nass.usda.gov • NASS / Research and Development Division • www.nass.usda.gov/research • NASS / Florida Field Office • www.nass.usda.gov/fl • claire_boryan@nass.usda.gov