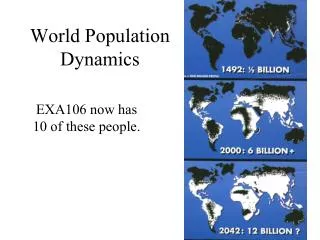
World Population
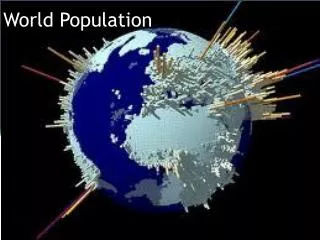
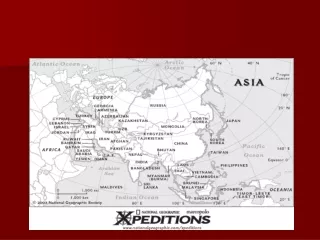
World Population. World Population Distribution 2000. SIBERIA. JAPAN. Taklimakan Desert & Kunlun Mts. Yellow R. Yangtze R. SAHARA DESERT. Ganges. NILE. The OUTBACK. Population Growth. 7 billion people live on 17% of the planet’s land. Population Growth.

World Population
E N D
Presentation Transcript
SIBERIA JAPAN Taklimakan Desert & Kunlun Mts. Yellow R. Yangtze R. SAHARA DESERT Ganges NILE The OUTBACK
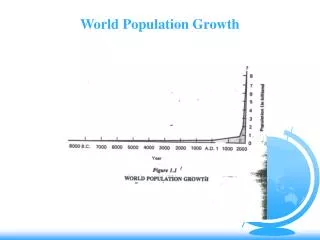
Population Growth • 7 billion people live on 17% of the planet’s land
Population Growth • Population should reach 7.8 billion by 2025.
Population Growth • Population is so high because birthrates have not declined as fast as death rates.
1000 People Birth Rate • Number of births per year for every 1,000 people per
Birth Rate • In some areas (ex. Asia, Africa, Latin America) the birthrate is high b/c of cultural beliefs about marriage, family, and the value of children.
1000 People Death Rate • Number of deaths per year for every 1,000 people per
Why have death rates gone down? • Improved health care • Abundance of food • Better living conditions • Cultural attitudes
Natural Increase • The difference between an area’s birthrate and death rate • This does not include immigration or emigration = Natural Increase minus
Challenges with population growth • Doubling time: the amount of years it takes a population to double in size • Challenges: • Difficulty producing enough food to feed them • Use up resources more quickly • Population unevenly distributed by age
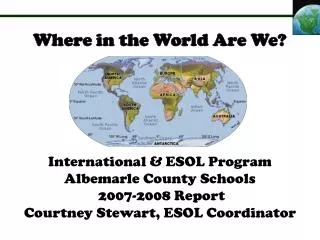
Defining the Population • Who are the people? • Demographics • Age • Race • Gender • Where do the people live? • Population Density • Number of people • Population Distribution • Urban • Rural
Shirkers Workers Shirkers birth 18 60 death
The History of Human Population Growth & Distribution 1 AD – 2030 The 8 Frames shown: 1 AD 1800 when the population reached the first billion the years the population reached each successive billion 2030 - the year that 8.2 billion people are expected to inhabit the Earth if current growth rates continue
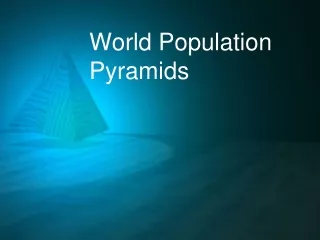
Composition or Structure • The Composition or Structure of a population is determined by its makeup in terms of demographics • Age • Gender • Education • Marital Status • etc.
Age-Gender Pyramid • This type of pyramid displays the % of each age group in the total population (normally done in 5 year groups)by a horizontal bar whose length represents its share of the population. • It instantly conveys the demographic situation of a country • In LDCs, pyramids actually look like a pyramid. • In MDCs, pyramids look more like a rectangle with a slight bulge in the middle (reflecting the aging of the population…which creates problems of its own…)
Negative Population Growth • When the annual death rate exceeds the annual birth rate • Hungary and Germany • Economics may be difficult to find enough workers to keep the economy going
Population Distribution • is the pattern of human settlement • People live on 30% of land b/c much of the earth’s land is inhospitable • Most people live where there is fertile soil, available water, & a climate w/o harsh extremes • Asia alone has 60%of the earth’s people
Population Density • The average number of people living on a square mile of land • How do we figure this out? • Take the population of a country • Ex: U.S. 310,414,105 for U.S. • Divide by the number of square miles • Ex: 3,537,441 mi² for United States • Equals: Population Density • United States: 88 people per mi²
Population Movement • Urbanization - growth of city populations brought about by migration - changes that come w/ increase in population • About ½ of the world’s population live in cities • Population of Mexico City rose from 5 million to 18 million from 1960 to 2000
Movement also occurs between countries • People who move from one country to another are called Emigrants in their homeland and Immigrants in their new country • Refugees – people fleeing to another country to escape persecution or disaster • Internally Displaced – people fleeing to another place within the SAME country to escape persecution or disaster (ex. Katrina victims fleeing New Orleans and coming to Houston.)