Download
1 / 11
120 likes | 416 Vues
World Population. This PowerPoint is associated with population statistics of the world and how population is dispersed throughout this world. Current population. At some point during last year the 7 th Billion person was born on this Earth.

E N D
World Population This PowerPoint is associated with population statistics of the world and how population is dispersed throughout this world.
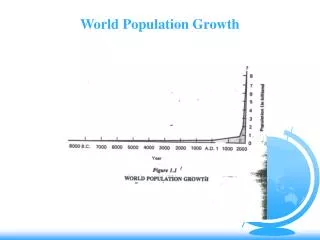
Current population • At some point during last year the 7th Billion person was born on this Earth. • As of this week the current population of the World is somewhere in the neighborhood of: 7,211,000,000 http://galen.metapath.org/popclk.html
That means approximately: • Total births per second: 4.2 • Total deaths per second: 1.8 • Net growth: 2.37 per second
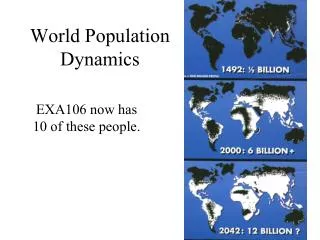
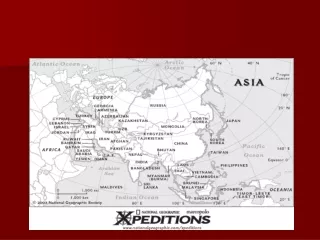
If we look at a world map… we all have and idea of what it looks like and we know that the largest continent is Asia but do you know that he largest countries are Russia followed by Canada, China and the US in land area.
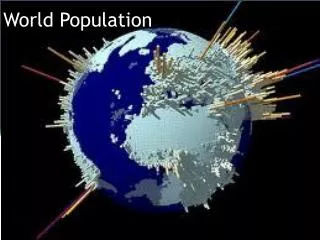
But….if we look it a world adjusted population map, it looks like this:
That means: • Although Asia has 30% of the world land area…..on that land is 61% of the worlds population. • 17.4 million sq. mi. • 3.879 billion people * In other words….. every 6 out of 10 people live in Asia
Comparison • In retrospect the US has 3,679,192 sq. mi……6.5% of the worlds land area • ….yet with a population of 312,983,800 (the world 3rd largest country) it only has 22% of the worlds population.
Population density • Population density is: population/land area • The result is the number of people per square mile. • Demographics is understanding the relationships of population between different areas.
Population Density TOTAL POPULATION OF AN AREA AREA IN SQUARE MILES
How Crowded is the World? • NameSq. Mi. (%)Population (%)Pop. Density • Africa 11,667,000 (20%) 669,752,000 (12%) 57 per sq mi • Antarctica 5,400,000 (9%) 00 per sq mi • Asia 17,383,000 (30%) 3,353,432,000 (61%) 193 per sq mi • Europe 3,807,000 (7%) 710,237,000 (13%) 187 per sq mi • N. Amer. 9,417,000 (16%) 442,115,000 (8%) 47 per sq mi • Oceania 3,284,000 (6%) 27,641,000 (.5%) 8 per sq mi • S. Amer. 6,879,000 (12%) 308,770,000 (5.5%) 45 per sq mi • Tokyo, Japan 840 25,800,00030715 • New York City 6,163 (309) 16,200,000 (7,322,564) 2697 (23,697) • Mexico City 571 18,131,00031,753 • Monaco, Europe .6 28,00046,667 p sq mi • Macao, Asia 6 310,0051,667 p sq mi • USA 3,679,192 305,756,80083.1 per sq mi • Alaska, USA 591,004 515,000.9 p sq mi • South Dakota, USA 77,120 715,000 9 p sq mi • Clark Co. 958 4,128 4 • Clark (City) 3.3 1292 391.5
Some Demographics • US Population Clock • US Debt Clock or US Debt Still • World Population Clock • World Information Clock