Download

1 / 16
160 likes | 293 Vues
This document explores critical issues regarding world population management, focusing on differences in population numbers between developed and developing nations. It covers essential demographic concepts such as population density, the significance of population censuses, and the construction of population pyramids. The text elaborates on factors influencing fertility and mortality rates, migration patterns, and the demographic transition model, which describes shifts in birth and death rates alongside socioeconomic development stages. Insights on achieving zero population growth are also discussed.

E N D
Issues to Consider… • Management of a resource…human resource. • Why so many people in developing nations and not so many in developed nations? • How many people on the planet is too many? 2
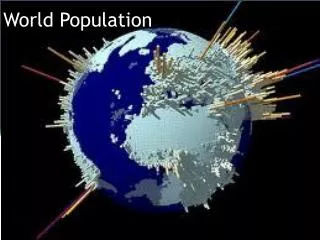
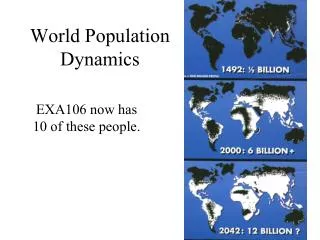
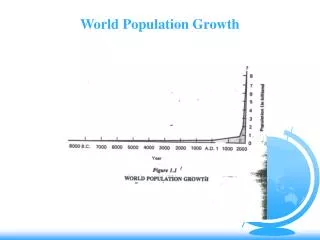
Keeping track of people… • In order for us to understand how people are counted we must look how many people are there in certain areas. This is known as population density. (number of people per square kilometre.) • Demography – is the study of population numbers. Governments place a high priority on knowing how many people there are. 4
Population Census • Most countries take a population census. This is a national count of population at regular intervals. (Canada has a major census every ten years-- ex. 1981, 1991, 2001, etc.) What does a populations census do? • Attempts to obtain a complete record about a countries people. • They may be physical facts, such as birthplace, age, and sex. • They may record social facts, which include language. spoken, ability to read and write, type of employment, and details about a person’s dwelling. 6
Population Structure • This is the total number of people, their ages and sex. Using these facts they are constructed in a diagram known as a population pyramid. Population Pyramid • This is a chart that categorizes and shows the age-sex structure of a population. Usually, it is divided into five year age groups, with the youngest on the bottom. Animated population pyramid 8
Fertility and Mortality • Fertility – deals with the factors affecting the rate of reproduction of the human race. • Mortality – deals with the death rate. • Birth rate – measures the number of live births per thousand of a population in one year. • Formula to calculate birth rate: Total live births divided by total population x 1000 9
Population Change Natural Increase Births – deaths = Natural Increase 10
Migration • (immigration or emigration). Net Migration • This is found by subtracting the number of people that leave a country by the number of people that enter the country. Total Population Change • Population change = Natural increase + Net Migration 11
Demographic Transition Model • This is a model that outlines the similarities between birth and death rate and economic development. There are 4 stages to the model: • Primitive • Early Expanding • Late expanding • Zero population growth 12
Stages of the Transition Model • Stage 1 Primitive – Life expectancy is very short at this stage. Very few countries are at this stage today. We see many births at this stage but a very short life span. • Stage 2 Early Expanding - There is a significant change in the death rate. Improved technology increases hygiene and medical techniques. Birth rates remain high due to a lack of education. Natural increase is very high due to the differences between the birth and death rates. 14
Stage 3 Late Expanding – This stage shows a rapid decrease in the birth rate. Standards of living increase and the costs of raising a child keep the average family size down. An increase in women in the work force also contributes to a decrease in birth rate. • Stage 4 Zero Population Growth – This is when a countries birth and death rates have reached the same level. Population levels do not change significantly from year to year. 15
Use the text to define the following terms: What can be done to cause a decrease in population trends to approach zero growth rates? • Primary education • Neo-natal care • Women’s rights 16