Evolution and Scoring Rules
This document provides an overview of scoring rules and matrices used in evolutionary sequence analysis. It details how scores are calculated based on matches, mismatches, and gaps, while exploring the significant impact of scoring rules on analysis outcomes. The document discusses the differences between nucleotide and amino acid sequences, introduces PAM and BLOSUM matrices as tools for alignment, and explains the concepts of likelihood ratios in determining evolutionary relationships. This information is essential for biologists and researchers engaged in genomics and bioinformatics. ###

Evolution and Scoring Rules
E N D
Presentation Transcript
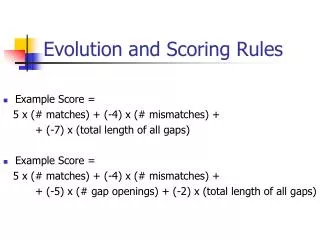
Evolution and Scoring Rules • Example Score = 5 x (# matches) + (-4) x (# mismatches) + + (-7) x (total length of all gaps) • Example Score = 5 x (# matches) + (-4) x (# mismatches) + + (-5) x (# gap openings) + (-2) x (total length of all gaps)
Scoring Rules vs. Scoring Matrices • Nucleotide vs. Amino Acid Sequence • The choice of a scoring rule can strongly influence the outcome of sequence analysis • Scoring matrices implicitly represent a particular theory of evolution • Elements of the matrices specify the similarity of one residue to another
Translation - Protein Synthesis:Every 3 nucleotides (codon) are translated into one amino acid DNA: A T G C 1:1 RNA: A U G C 3:1 Protein: 20 amino acids Replication Transcription Translation
Translation - Protein Synthesis RNA Protein 5’ -> 3’ : N-term -> C-term
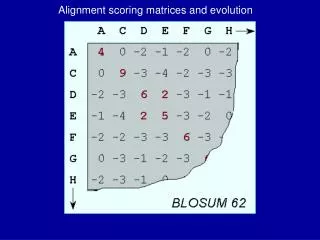
Log Likelihoods used as Scoring Matrices:PAM - % Accepted Mutations:1500 changes in 71 groups w/ > 85% similarityBLOSUM – Blocks Substitution Matrix:2000 “blocks” from 500 families
Likelihood Ratio for Aligning a Single Pair of Residues • Above: the probability that two residues are aligned by evolutionary descent • Below: the probability that they are aligned by chance • Pi, Pj are frequencies of residue i and j in all protein sequences (abundance)
The alignment score of aligning two sequences is the log likelihood ratio of the alignment under two models • Common ancestry • By chance
PAM and BLOSUM matrices are all log likelihood matrices • More specificly: • An alignment that scores 6 means that the alignment by common ancestry is 2^(6/2)=8 times as likely as expected by chance.
BLOSUM matrices for Protein • S. Henikoff and J. Henikoff (1992). “Amino acid substitution matrices from protein blocks”. PNAS 89: 10915-10919 • Training Data: ~2000 conserved blocks from BLOCKS database. Ungapped, aligned protein segments. Each block represents a conserved region of a protein family
Constructing BLOSUM Matrices of Specific Similarities • Sets of sequences have widely varying similarity. Sequences with above a threshold similarity are clustered. • If clustering threshold is 62%, final matrix is BLOSUM62
A toy example of constructing a BLOSUM matrix from 4 training sequences
PAM Matrices (Point Accepted Mutations) Mutations accepted by natural selection
PAM Matrices • Accepted Point Mutation • Atlas of Protein Sequence and Structure, Suppl 3, 1978, M.O. Dayhoff. ed. National Biomedical Research Foundation, 1 • Based on evolutionary principles
Total Mutation Rate is the total mutation rate of all amino acids
Mutation Probability Matrix Normalized Such that the Total Mutation Rate is 1%
-- PAM1 mutation prob. matr. --PAM2 Mutation Probability Matrix? -- Mutations that happen in twice the evolution period of that for a PAM1
In two PAM1 periods: • {AR} = {AA and AR} or {AN and NR} or {AD and DR} or … or {AV and VR}
PAM60—60%, PAM80—50%, • PAM120—40% • PAM-250 matrix provides a better scoring alignment than lower-numbered PAM matrices for proteins of 14-27% similarity
PAM Based on extrapolation of a small evol. Period Track evolutionary origins Homologous seq.s during evolution BLOSUM Based on a range of evol. Periods Conserved blocks Find conserved domains Comparing Scoring Matrix