A Novel Approach to Identifying Differential Gene Expression
280 likes | 505 Vues
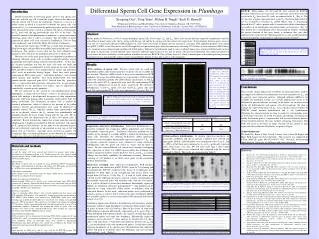
A Novel Approach to Identifying Differential Gene Expression. Robert J. Pignolo and Oriana Galardi-Este. Methods used to identify differential gene expression. Subtractive cDNA libraries and probes Differential display Microarray analysis 2-D protein electrophoresis.

A Novel Approach to Identifying Differential Gene Expression
E N D
Presentation Transcript
A Novel Approach to Identifying Differential Gene Expression Robert J. Pignolo and Oriana Galardi-Este
Methods used to identify differential gene expression • Subtractive cDNA libraries and probes • Differential display • Microarray analysis • 2-D protein electrophoresis
2-D separation of RNA by length and secondary structure • First dimension: separation by length (molecular weight) using glyoxal denaturation • Second dimension: separation by secondary structure after renaturation (occurs at pH>8 with ammonium hydroxide)
2-D Separation of RNA Length (molecular weight) Secondary structure
Length (molecular weight) 28S 18S 2-D Separation of RNA: 1st Dimension
Non-radioactive detection of RNA • UV light alone (limit = 4.2 ug) • Methylene blue (limit = 2.1 ug) • Ethidium bromide (limit = < 0.5 ug) • Acridine orange (0.05 ug dsRNA; 0.1 ug ssRNA)
Detection of RNA using acridine orange Length (molecular weight) Length (molecular weight) Secondary Structure 28S 18S
Identification of separated RNA I • Excise band • Isolate RNA • Perform cDNA synthesis • Clone into sequencing vector • Submit for sequencing
Identification of separated RNA II • Migration pattern in two dimensions should permit mapping based on specific coordinates • Coordinates can be measured relative to most abundant RNAs (e.g., 28S and 18S rRNAs)
Length (molecular weight) 28S 18S Attempt #1…
Testing Acridine Orange • Re-done using mini-gel and non-denatured RNA • Expected results: red single-stranded green double-stranded So mostly green because no glyoxal used
Attempt # 2… Lane 1: Denatured Sample (Treated with glyoxal) Lane 2: Non-denatured Sample (Not treated with glyoxal)
Questions to Answer… • Why am I only seeing 28S and 18S big bands? Where are all the smaller bands? • What kind of UV illuminator will let me see the red and green expected results from the acridine orange? • Why are bands in Acridine Orange test smeared? Why are the bands all red if they are not denatured?
Next Step: • Run mini-gel with: Lane 1 DNA sample + EtBr Lane 2 RNA sample + EtBr Lane 9 DNA sample + Acridine Orange Lane 10 RNA sample + Acridine Orange
Next Try: • Newly found paper mentions staining and de-staining of Acridine Orange should be done in the dark • SO, we repeated experiment without EtBr and with staining done in dark and we found…
Results DNA RNA DNA RNA After 1 hour of de-staining… After 4 days of de-staining… TOTAL FLUKE
Yay! Now what? • Now we’ve seen the green and red. • We know the UV light box works. • Now we need to test whether denatured and non-denatured RNA are distinguishable from each other in terms of color and migration
Results DNA RNA DENATURED • 2 clear green DNA bands • 2 clear red non-denatured RNA bands • Non-denatured RNA migrated further than denatured RNA (expected) • Denatured RNA very fuzzy and possibly more red?
What about the big-Gels? • All the while, nothing is working on the big-gels…gels keep turning out clear • Explanation: Glyoxal Loading Buffer made with wrong concentrations!
Results after changing buffer • Finally saw 2 red bands… • But where are all the other bands??
Next 3 experiments: • 1) DNA / nRNA / gRNA run on mini-gel, stained with EtBr + AO • 2) DNA / nRNA / gRNA run on mini-gel stained with AO only • 3) DNA / nRNA / gRNA run on 1.5% mini-gel stained with AO only In all 3, nRNA and gRNA treated identically
So Far… • Why am I only seeing 28S and 18S big bands? Where are all the smaller bands? • Still don’t know… • What kind of UV illuminator will let me see the red and green expected results from the acridine orange? • Turns out it was a de-staining problem • Why are bands in Acridine Orange test smeared? Why are the bands all red if they are not denatured? Still having problems with this – unsure why bands are not as sharp as they are when stained with EtBr