
IEEE OU Analytics – Landing Page
Click Map to view various Geo Analysis by IEEE Boundaries. IEEE OU Analytics – Landing Page. Membership Statistics. Map – Region Summary. Provides counts and interactive views of IEEE OUs and counts of IEEE/Society members on a World Map using IEEE Boundaries. Membership Statistics.

IEEE OU Analytics – Landing Page
E N D
Presentation Transcript
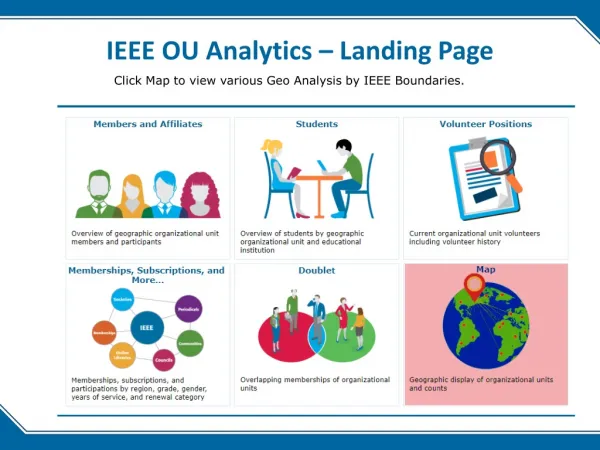
Click Map to view various Geo Analysis by IEEE Boundaries. IEEE OU Analytics – Landing Page
Membership Statistics Map – Region Summary Provides counts and interactive views of IEEE OUs and counts of IEEE/Society members on a World Map using IEEE Boundaries.
Membership Statistics Map – IEEE/Society Member Summary – IEEE “Region” View Provides counts and interactive views of counts of IEEE members with customized views by Region. (Region view displayed below) Hover over bar to view tooltip with counts of active IEEE members for all Regions Hover over a Region to view tooltip or click within map. Hover over bars to view tooltip with counts of active IEEE members for that Region.
Membership Statistics Map – IEEE/Society Member Summary – IEEE “Section” View Provides counts and interactive views of counts of IEEE members with customized views by Section. (View displayed is Region 9) Hover over bar to view tooltip with counts of active IEEE members for all Sections. Hover over a Section to view tooltip or click within map. Color variation depicts concentration of members Hover over bars to view tooltip with counts of active IEEE members for that Section.
Membership Statistics Map – IEEE/Society Member Summary – Society “Region” View Provides counts and interactive views of counts of Society members with customized views by Region, Section or Subsection. (Region view displayed below) Hover over bar to view tooltip with counts of active Society members for all Regions. Hover over a Region to view tooltip or click within map. Hover over bars to view tooltip with counts of active Society members for that Region.
Membership Statistics Map – IEEE/Society Member Summary – Society “Section” View Provides counts and interactive views of counts of Society members with customized views by Region, Section or Subsection. (View displayed is Region 9 all Societies) Hover over bar to view tooltip with counts of active Society members for all Sections. Hover over a Section to view tooltip or click within map. Color variation depicts concentration of members Hover over bars to view tooltip with counts of active Society members for that Section.
Provides counts and interactive views of Chapters, Joint Chapters and Student Branch Chapters by Section and Society/Technical Council. (View displays all Chapter Types) Map - Chapter Summary Hover over bar to view tooltip with Chapter counts by Section. Hover over bar to view tooltip with Chapter counts by Type for Society/Technical Council. Hover over a Section to view tooltip for count of Chapters Color variation depicts concentration of Chapters
Provides an interactive customizable list of Chapters with member counts by Section for Societies/Technical Councils. Map – Member Count by Chapter Hover over a bar to view tooltip for count of members in the Chapter
Identifies Sections with a minimum of 12 eligible Society members for potential chapter formation. Number of Chapter opportunities displayed by Society. Number of members by grade displayed within relevant Sections. (View displayed for AES Society) Map – Potential Chapter Opportunities Hover over bar to view tooltip for count of Sections with Chapter opportunities. Hover over bars, in box below, to view tooltip with Grade counts by Section. Hover over a Section to view tooltip with count of eligible members to form Chapter
Provides counts and interactive views of Affinity Groups by Section and HKN University Chapters. Map – Affinity Groups Hover over bars to view tooltip with Grade counts Hover over bars to view tooltip with counts by Section Hover over a Section to view tooltip with count of Affinity Groups and members Color variation depicts concentration of Affinity Groups
Provides counts and interactive views of Student Branches and their units. Map – Student Branches Download a list of Schools with Student Branch Name and Section included. Click on the title “Student Branches” to select. Click Download and Crosstab. Hover over bar to view tooltip with counts of units and attendees by Student Branch Hover over bar to view tooltip with counts of attendees within unit Color variation depicts concentration of Student Branches


