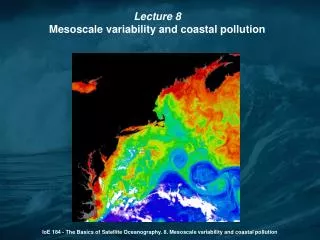
Mesoscale variability and drizzle in stratocumulus
430 likes | 593 Vues
Mesoscale variability and drizzle in stratocumulus. Kim Comstock General Exam 13 June 2003. x. image courtesy of Rob Wood. EPIC 2001 Sc cruise. EPIC 2001 Sc cruise. EPIC 2001 Sc data. Data set Meteorological measurements on ship and buoy (T, q, U, LW, SST) Ceilometer

Mesoscale variability and drizzle in stratocumulus
E N D
Presentation Transcript
Mesoscale variability and drizzle in stratocumulus Kim Comstock General Exam 13 June 2003
x image courtesy of Rob Wood EPIC 2001 Sc cruise EPIC 2001 Sc cruise
EPIC 2001 Sc data • Data set • Meteorological measurements on ship and buoy (T, q, U, LW, SST) • Ceilometer • MMCR and C-band radar • GOES satellite imagery
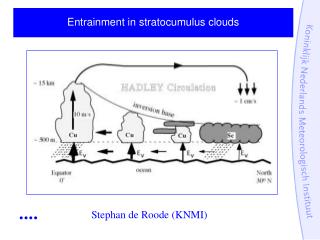
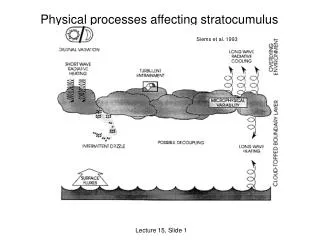
Why are Sc important? • Areal extent and persistence • Effect on radiation budget
Key parameter: Sc albedo • mean droplet size • CCN aerosols • cloud thickness • turbulence, entrainment, drizzle • diurnal and mesoscale variations • horizontal variability • mesoscale circulations • drizzle?
Central Questions To understand the physical processes that govern variability in Sc albedo, we must answer the following questions: • What is the structure and life cycle of Sc? • What is the role of drizzle in mesoscale variability? • What role does the diurnal cycle play?
Goals: using EPIC data to address central questions • Determine drizzle cell properties from C-band radar. • Obtain and physically interpret signatures of mesoscale variability from ship and buoy time series. • Estimate amount of drizzle and relate to mesoscale variability. • Analyze diurnal cycle and determine how it modulates all of the above.
hourly cloud base hourly cloud top hourly LCL -60 -40 -20 0 15 dBZ MMCR time-height section
Quantifying drizzle • We have reflectivity (Z) over a wide area around the ship from the C-band radar, but we want to know rain rate (R) information. • No suitable Z-R relationships exist for drizzle. • We developed Z-R relationships, Z=aRb , from in-situ DSD data at cloud base and at the surface: • aircraft (N Atlantic) and surface (SE Pacific) data • linear least squares regression (log10Z, log10R) • Ideally, we want to know R at the surface.
Quantifying drizzle - method • Evaporation-sedimentation model • assumes truncated exponential drop-size distribution (DSD) with mean size r • run with various r’s and drop concentrations • Obtain model reflectivity profiles (Z(z)/ZCB) and compare with MMCR profiles. • infer DSD for each MMCR profile • use model to extrapolate cloud base DSD characteristics to the surface (get surface R) • Develop “bi-level” Z-R relationship using cloud base ZCB to predict surface Rs.
Quantifying drizzle - results • Apply bi-level Z-R to C-band cloud reflectivity data to obtain area-averaged rain rate at the surface. • Average drizzle rates for EPIC Sc • 0.93 mm/day at cloud base (range 0.3-3) • 0.13 mm/day at the surface (range 0.02-0.6) • Uncertainties due to • C-band calibration (2.5 dBZ) • Z-R fitting procedure
Diurnal cycle • At night the BL tends to be well mixed (coupled). • During the day, the BL is less well mixed (decoupled). • It tends to drizzle most during the early morning.
cloud thickness 410 ± 60 m U cloud base 930 ± 30 m ~ 30 km U T Coupled BL
cloud thickness 310 ± 110 m cloud base 930 ± 60 m Decoupled BL
cloud thickness 415 ± 150 m cloud base 890 ± 110 m Drizzling BL
Mesoscale variability Goes 8 Visible 19 October 0545 Local Time
Summary of previous work • Though the diurnal signal is dominant, mesoscale structure is an integral part of the dynamics of the Sc BL. • BL time series classified as coupled, decoupled or drizzling. • There is a significant amount of drizzle in the SE Pacific BL, and it is associated with increased mesoscale variability
Future work • Compare Sc mesoscale structure with previous studies of mesoscale cellular convection (MCC) • Further examine radar data for 2-D and 3-D information • circulations (also use DYCOMS II and possibly TEPPS Sc) • compositing/tracking • Analyze buoy time series for mesoscale variability in relation to “drizzle”.
q MCC comparisons Compare our coupled cell with closed cell from Rothermel and Agee (1980)
Radial velocities • EPIC C-band volume-scan radial velocities are probably unusable due to pointing errors associated with these scans. • Vertical RHI scans appear less susceptible to error, so the radial velocity data (in the RHIs) may be useful for qualitatively looking at 3-D circulations in the BL. • TEPPS volume scans and DYCOMS II vertically-pointing radar data are other possibilities.
0 30 km 15 km 90 270 180 Example
EPIC Sc RHIs 17 October 2001 1058 UTC 2 km 19 km 0 90 180 270 dBZ
EPIC Sc RHIs 17 October 2001 1058 UTC 2 km 19 km 0 90 180 270 m/s
Comparison with DYCOMS II • Anticipate receiving DYCOMS II aircraft data (vertically-pointing MMCR data and time series) • look for circulations associated with closed cells and drizzling conditions • look at variability associated with drizzle (flight RF02)
C-band composite Cell 1 Cell 2
Time avg PDF of dBZ Average reflectivity Time (hr UTC) dBZ Compositing/tracking: preliminary results • Examples from tracked drizzle cells
Drizzle’s signature • Air-sea temperature difference appears to be a good indication of drizzle occurring in the area.
Drizzle climatology • Will apply air-sea DT analysis to year-long buoy time series to determine • frequency and persistence of drizzle • diurnal cycle information • cloud fraction associated with drizzle • Longwave radiation can be used as a proxy for cloud fraction in the buoy data series. • relationship to satellite images
satellite overpasses Buoy data • Example of SST-Ta for 15 September 2001
WHOI BUOY Buoy data GOES 8 IR 1145 UTC
WHOI BUOY Buoy data GOES 8 Vis 1445 UTC
WHOI BUOY Buoy data GOES 8 Vis 1745 UTC
WHOI BUOY Buoy data GOES 8 Vis 2045 UTC
LW as a proxy for cloud fraction LW-sTa4 (W/m2)
Drizzle and open cells GOES image (color) and C-band reflectivity (gray scale) GOES image only
(Less) drizzle and closed cells GOES image (color) and C-band reflectivity (gray scale) GOES image only
Evaporation-sedimentation model r (mm) N (#/L)
MCC – closed cell Moyer & Young 1994
Tracking algorithm Williams and Houze 1987