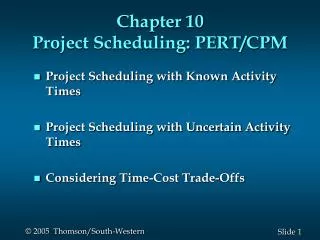
Planning (Scheduling) with Network , PERT , & CPM
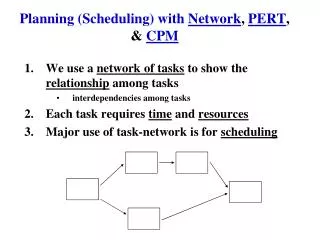
Planning (Scheduling) with Network , PERT , & CPM. We use a network of tasks to show the relationship among tasks interdependencies among tasks Each task requires time and resources Major use of task-network is for scheduling. Relevant “Dependency” Characteristics of Tasks.

Planning (Scheduling) with Network , PERT , & CPM
E N D
Presentation Transcript
Planning (Scheduling) with Network, PERT, & CPM • We use a network of tasks to show the relationship among tasks • interdependencies among tasks • Each task requires time and resources • Major use of task-network is for scheduling
Relevant “Dependency” Characteristics of Tasks • For each Task, T, (or Activity), we need to consider: • its predecessor tasks • tasks that must be completed before T • its successor tasks • tasks that can not begin until T is completed • its parallel tasks • tasks that are independent and may be performed simultaneously with T
Tasks and Immediate Predecessors Table Duration Immediate Predecessors Tasks A - 20 time units B A 25 C B 10 D C 15 E C 40 F 25 E, D
Activity-on-Arrow Representation Task Z , 25 time units Task and the duration are represented as an arrow between two nodes, which represent the beginning and end of a task
Activity-on-Node Representation Task Z (25 time units) The task and the duration are both represented in the Node We will use this notation
Activity-on-Node Representation of the 6 Tasks from the ‘previous’ table D 15 C 10 A 20 B 25 F 25 E 40 A - 20 time units B A 25 C B 10 D C 15 E C 40 E, D F 25
Using the Task-Network in Project Planning • Major usage is for determining how long will the project take . • The “longest” paththrough the network is the expected project duration. • It is also called the “CRITICAL” Path • Note that: if there is a delay in any of the tasks on a critical path, the result would be a delay in the completion of the overall project.
Critical Path of the Previous Task-Network D 15 A 20 B 25 C 10 F 25 E 40 Tasks, A,B,C,E, and F are on the CRITICAL Path Expected Project duration is 20+25+10+40+25 = 120 time units
Earliest Start(ES) and Earliest Finish(EF) of Tasks by Taking a “Forward Pass” through the Network D 15 A 20 B 25 C 10 F 25 Task ES EF E 40 A 20 0 B 20 45 C 45 55 D 55 70 ** Note that EF of task E is 95 which forces ES of task F to be 95. E 55 95 ** F 95 120
Late Start(LS) and Late Finish(LF) of Tasks by Taking a “Backward Pass” through the Network D 15 A 20 B 25 C 10 F 25 Task LS LF E 40 20 A 0 B 20 45 C 45 55 D ** 80 95 ** Note that LS of task D is 80 because it needs only 15 time units to complete the task. But you can’t use it as C’s late finish time. E 55 95 F 95 120
Slack Time • Note that for Task D in the previous example : • ES is 55 and EF is 70 • LS is 80 and LF is 95 • so, we can actually take the LS as the actual start time and not affect the over-all project schedule • Slack timeof an activity is defined as the difference in start time between when a (non-critical) taskmust start at the latestand when it can startat the earliest • Slack Time= (LS – ES) or (LF – EF) • in the above case slack time is 80-55 = 25 time units
Free Slack • We are interested in slack time that allows us to delay the start of an activity without impacting the start time of its successor. • Free Slack (D) = ES (of the earliest successor of D) – EF(of D) • For Task D of the previous example : • Free Slack = 95 - 70 = 25 • In this case, Slack time is the same as Free Slack; so the start of activity D can be delayed by 25 time units and there is no impact.
Another Example D 3 B 5 F 5 A 10 E 5 -Activities A,C, F are on the Critical Path. -Next longest path is A,B,E,F C 15 Act. ES EF LS LF. For Activity B (a non-critical activity): -slack time = LS - ES = 15 - 10 = 5 -free slack = earliest suc. ES - EF = 15 -15 = 0 -this says even if there is a 5 unit of slack time, there is no free time For Activity D (a non-critical activity): -slack time = LS -ES = 22 - 15 = 7 -free slack = earliest suc. ES -EF = 25 - 18 = 7 - this says we can delay activity D by 7 units without hurting the successor activity A 10 0 10 0 B 10 15 15 20 C 10 25 10 25 D 15 18 22 25 E 15 20 20 25 F 25 30 25 30
Program Evaluation & Review Technique(PERT) • PERT is based on the critical path that was addressed in the Network technique, except the task time is estimated using “expected” time • Expected task time (e-t-t)for each of the tasks on the critical path is computed as follows: • e-t-t = (optimistic-time + 4*most-likely-time + pessimistic-time)/6 • Expected Project time (EP) is the sum of all the e-t-t’son the critical path.
Additional Usage of PERT • Define the variance of any task to be Vart =(optt – pesst)/6 • Define variance of the project, Varp , = SQRT( ∑(Vart)2 ) where Vart’s are the variance of only the critical path tasks. • Then the probability of meeting some schedule duration, Ts, is defined as Z = (Ts – EP) / Varp ** Read the probability value from the statistical table of Z values opt = optimistic estimate; pess = pessimistic estimate
Example of the Probability of Meeting Schedule c (O-P/6)2 ett P M O 47 a 29 17 30 25 20 a b e f 24 12 6 13 b 9 30 13 6 5 d 19 16 28 20 4 c 16 16 13 19 1 d 16 5 2 4 14 e 6 Expected Project Time, EP = 30+13+20+6+5 = 74 1 f 5 2 5 8 What’s the probability that project will complete in 77 time units? Z = (77 -74)/ SQRT(25+9+4+4+1) = 3/SQRT(43) = 3/6.5 = .46 Reading the Z table gives us the number .177, which may be interpreted as: “The probability that the project completes between 74 to 77 time units is 17.7% if the expected project time, EP, is 74 time units ”
Z- Statistics 17.7% 34.1% 34.1% 47.7% 47.7% Z= -1 Z= 1 or 1 std dev. μ = EP or Z = 0 Z= 2 Z= -2 Z=.46
Critical Path Method (CPM) • CPM is concerned with the relationship of cost to schedule. • Given a time duration, T, and a cost, C, for a task, what would be the shortest time duration, Ts, if the associated cost, Cs, is allowed to increase? (Be very careful with this because thousands of software managers have been “burned” with this temptation!) • The cost slope for each task on the critical path may be defined as follows: • cost slope for task i = | (Ci - Csi) / (Ti- Tsi) | We use absolute value to evade negative slopes COST (Tsi , Csi) Csi (Ti , Ci) Ci TIME Tsi Ti
CPM (cont.) • Compute the task slope(s) of all the tasks. • The lowest or smallest cost slope is the most effective time/cost trade-off task; however, the most effective one for the project would be the lowest cost slope of the task residing on the critical path. • We would apply more resources to that task to shorten the critical path, thus shortening the total project duration; then go on to look at the next lowest cost slope of tasks on the critical path. • One would stop this process when the “desired” schedule and the affordable cost is reached.