Analyzing Upwelling Velocity Distribution in Northeast Taiwan
This seminar report, presented by Mao-Lin Shen on November 5, 2019, focuses on the upwelling velocity distribution off the cold dome in Northeast Taiwan. It discusses the regional and daily variations in upwelling velocities influenced by Ekman pumping and other mechanical processes in the East China Sea and Kuroshio regions. The report includes comparisons of temperature gradients resulting from changing topographies, emphasizing the importance of wind stress on monthly and daily scales. Visuals such as figures and charts aid in understanding the data presented.

Analyzing Upwelling Velocity Distribution in Northeast Taiwan
E N D
Presentation Transcript
Seminar report Cold-dome off Northeast Taiwan 報告人:沈茂霖 (Mao-Lin Shen) 2019/11/5
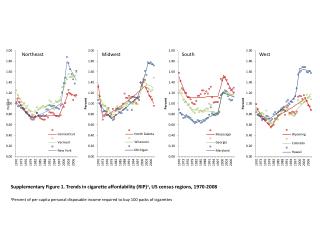
Upwelling velocity distribution Fig. Regional distribution of upwelling velocities.
Upwelling velocity distribution Fig. Regional distribution of upwelling velocities.
Ekman pumping velocity • Eq. (3) of Chang et al. (2009)
Temperature comparison Fig. Location of temperature comparison.
Temperature comparison Fig. Temperature comparison in different locations.
Temperature gradient Fig. Temperature gradient introduced by different mechanics within ECS region.
Temperature gradient Fig. Temperature gradient introduced by different mechanics within Kuroshio region.
Changing topography Fig. Results comparison of different topography.
Daily upwelling velocities Fig. Upwelling velocities calculated by monthly and daily wind stress.