Download
1 / 18
390 likes | 1.68k Vues
Chapter 10 ATOMIC EMISSION SPECTROMETRY. Advantages emission Spectrometer over absorption methods: 1. Lower interelement interference because of higher temperature. 2. Emission spectra are obtained under a single set of excitation conditions and several elements can be recorded

E N D
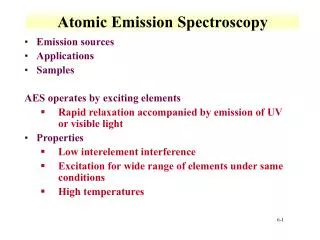
Chapter 10ATOMIC EMISSION SPECTROMETRY Advantages emission Spectrometer over absorption methods: 1. Lower interelement interference because of higher temperature. 2. Emission spectra are obtained under a single set of excitation conditions and several elements can be recorded simultaneously. 3. Multielement can be analyzed from very small sample. 4. Low concentration refractory compounds can be determined 5. Nonmetals can also be determined by plasma sources. 6. Very high concentration range (linear range) for plasma sources. …Advantages of emission Spectrometry continued… 4. Low concentration refractory compounds can be determined. 5. Nonmetals can also be determined by plasma sources. 6. Very high concentration range (linear range) for plasma sources.
Disadvantages of emission spectrometry: 1. More expensive equipments needed. 2. Procedures are somewhat complicated than absorption method. 3. More operating cost than absorption technique. Atomic emission and absorption methods are complementary to each other.
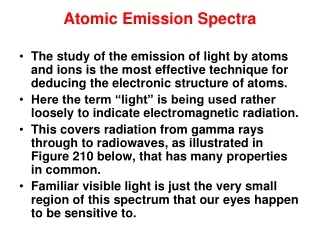
EMISSION SPECTROSCOPY BASED ON PLASMA SOURCES A plasma is an electrical conducting gaseous mixture containing a significant concentration of cations and electrons. (The concentrations of the two are such that the net charge approaches zero). In the argon plasma frequently employed for emission analyses, argon ions and electrons are the principle conducting species, although cations from the sample will also be present in lesser amounts.
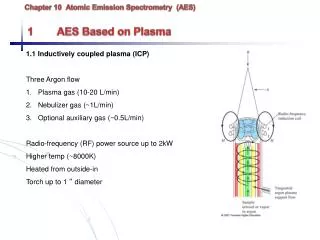
…Emission spectroscopy based on plasma sources continued… Argon ions, once formed in a plasma, are capable of absorbing sufficient power from an external source to maintain the temperature at a level at which further ionization sustains the plasma indefinitely; temperatures as great as 10,000 K are encountered. Three types of high-temperature plasmas are encountered: (1) the inductively coupled plasma (ICP), (2) the direct current plasma (DCP), and (3) the microwave induced plasma (MIP).
The Inductively Coupled Plasma Source Fig. 10-1 is a schematic of a typical inductively coupled plasma source called a torch. It consists of three concentric quartz tubes through which streams of argon gas flow. The diameter of the largest tube is often about 2.5 cm. Surrounding the top of this tube is a water-cooled induction coil that is powered by a radio-frequency generator. Which is capable of producing 0.5 to 2 kW of power at about 27 or 41 MHz. Ionization of the flowing argon is initiated by a spark from a Tesla coil.
…The Inductively Coupled Plasma Source continued… The resulting ions, and their associated electrons, then interact with the fluctuating magnetic field produced by the induction coil. This interaction caused the ions and electrons within the coil to flow in the closed annular paths depicted in Fig. 10-1. The temperature of the plasma formed in this way is high enough to require thermal isolation of the outer quartz cylinder. This isolation is achieved by flowing argon tangentially around the walls of the tube as indicated by the arrows in Fig. 10-1.
Sample Introduction: Sample are carried into the torch by argon flowing at 0.3 to 1.5 L/min through the central quartz tube. Samples are introduced into the argon flow by nebulizers. Fig. 10-2 shows a typical arrangement. Here, the sample is nebulized in a cross-flow nebulizer by a stream of argon, and the resulting finely divided droplets are carried into the plasma. Aerosols have also been produced from liquids by means of an ultrasonic nebulizer. Another method of introducing liquid and solid samples into a plasma is by electrothermal vaporization. Here, the sample is vaporized in a furnace.
…Sample Introduction continued… Fig. 10-3 shows an electrohermal vaporizer offered by one instruments manufacturer in which vapor formation takes place on an open graphite rod. The vapor is then carried into a plasma torch by a flow of argon. Electrothermal vaporization coupled with a plasma torch offers the microsampling capabilities and low detection limits of electrothermal furnaces while maintaining the wide linear working range, the freedom from interference, and the multielement capabilities of ICP.
Plasma Appearance and Spectra: The typical plasma has a very intense, brilliant white, nontransparent core topped by a flamelike tail. The core, which extends a few millimeters above the tube, is made up of a continuum upon which is superimposed the atomic spectrum for argon. The source of the continuum apparently arises from recombination of argon and other ions with electrons.
…Plasma Appearance and Spectra continued… In the region 10 to 30 mm above the core, the continuum fades, and the plasma is optically transparent. Spectral observations are generally made at a height of 15 to 20 mm above the induction coil. Here, the background radiation is remarkably free of argon lines and is well suited for analysis. Many of the most sensitive analyte lines in this region of the plasma are from ions, such as Ca+, Ca2+, Cd+, Cr2+, and Mn2+.
Analyte Atomization and Ionization: Fig. 10-4 shows temperatures at various parts of the plasma. The sample atoms will have resided for about 2 ms at temperatures ranging from 4000 to 8000 K. These times and temperatures are roughly two to three times greater than those found in the hottest combustion flames used in flame methods. As a consequence, atomization is more complete, and fewer chemical interference problems arise. Surprisingly, ionization interference effects are small or nonexistent, because the electron concentration from ionization of the argon is large compared with that resulting from ionization of sample components.
… Analyte Atomization and Ionization continued… Several other advantages are associated with the plasma source. First, atomization occurs in a chemically inert environment, which tends to enhance the lifetime of the analyte by preventing oxide formation. In addition, and in contrast to arc, spark, and flame, the temperature cross section of the plasma is relatively uniform; as a consequence, self-absorption and self-reversal effects are not encountered. Thus, linear calibration curves over several orders of magnitude of concentration are usually observed.
Application of Plasma Sources Plasma sources are rich in characteristic emission lines, which makes them useful for both qualitative and quantitative elemental analysis. The inductively coupled plasma yield significantly better quantitative analytical data than other emission sources do. The excellence of these results stems from their high stability, low noise, low background, and freedom from interferences.
Sample Preparation: Inductively coupled plasma emission spectroscopy is used primarily for the qualitative and quantitative analysis of samples that are dissolved or suspended in aqueous or organic liquids. With plasma emission, methods do exist for the direct analysis of solids. These procedures include electrothermal vaporization, laser and spark ablation, and glow discharge.
Elements Determined: In principle, all metallic elements can be determined by plasma emission spectrometry. A vacuum spectrometer is necessary for the determination of boron, phosphorus, nitrogen, sulfur, and carbon because the emission lines for these elements lie at wavelengths below 180 nm where components of the atmosphere absorb. The usefulness for the alkali metals is limited. Plasma emission spectroscopy is generally limited to the determination of about 60 elements. Fig. 10-13 is a periodic table showing the applicability of inductively coupled plasma emission spectrometry to various elements.
Calibration Curves: Calibration curves for plasma emission spectrometry most often consist of a plot of the output current or voltage of a transducer as a function of analyte concentration. When the range of concentrations is large, log-log plots are employed instead. Fig. 10-14 shows typical calibration curves for four trace elements present in steel samples. An internal standard is often used in emission spectrometry.
…Calibration Curves continued… In this case the vertical axis of the calibration curve is the ratio or the log ratio of the detector signal for the analyte to the detector signal for the internal standard. Fig. 10-15 shows calibration curves for several elements. In these experiments a fixed amount of yttrium was incorporated in all of the standards, and the relative intensity of the analyte line to that of an yttrium line at 242.2 nm served as the analytical parameter.
Detection Limits: The detection limits with the inductively coupled plasma source appear comparable to or better than other atomic spectral procedures. Table 10-3 compares these limits for several of these methods. More elements can be detected at levels of ten parts-per billion or less with plasma excitation than with other emission or absorption methods.