Download
1 / 35
350 likes | 485 Vues
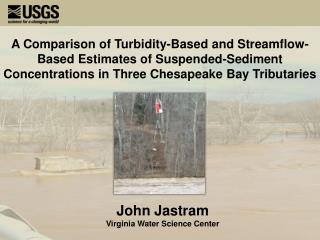
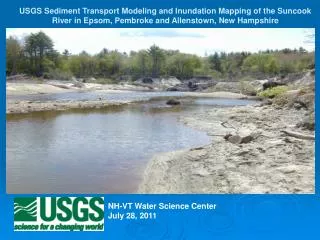
USGS Sediment Transport Modeling and Inundation Mapping of the Suncook River in Epsom, Pembroke and Allenstown, New Hampshire. NH-VT Water Science Center July 28, 2011. Suncook River Study Area. May 2006 Flood.

E N D
USGS Sediment Transport Modeling and Inundation Mapping of the Suncook River in Epsom, Pembroke and Allenstown, New Hampshire NH-VT Water Science Center July 28, 2011
May 2006 Flood • Flooding resulted from sustained rainfall event of up to 14 inches of rain in coastal areas, 11 inches in central NH • Preceded by dry winter and early spring runoff • May 2006 peak flow at USGS Suncook River streamgage in North Chichester, NH was 7,600 cfs (Olson, 2007) with a recurrence interval of between 50 and 100 years. • 3rd highest flood of record at USGS Suncook River streamgage 7-Day Precipitation Totals ending on May 18, 2006
April 2007 Flood • Flooding resulted from 3-day (April 16-18) rainfall event that dropped up to 7 inches of rain in areas of NH. • April 2007 peak flow at USGS Suncook River streamgage in North Chichester, NH was 10,600 cfs (Flynn, 2008) with a recurrence interval of between 100 and 500 years. • 2nd highest flood of record at USGS Suncook River streamgage. April 2007 Precipitation Totals (2nd wettest April ever recorded in Concord, NH)
Suncook River Flood Mapping Study and Sediment Characterization • FEMA funded the US Geological Survey to create updated flood mapping and assess characteristics and movement of sediments in the Suncook River from Epsom to the Merrimack River confluence. • Study purpose is to aid in restoration efforts by furthering the understanding of the impact of the transported sediment on the surrounding environment.
Suncook River Flood Study Changes in the 100-year recurrence-interval flood elevation from the 1979 flood study: Typically less than 2-feet with the exception of a location 900 feet upstream of the avulsion where due to backwater from the dams in the abandoned channel was 12 feet higher in the 1979 study. Report available online at: http://pubs.usgs.gov/sir/2010/5127/
Suncook River Sediment Transport Characterization Study • Quantified sediment in suspended, bed load and bed material form to calibrate and verify quasi-unsteady state HEC-RAS sediment transport and flow model by comparing field collected vs. model predicted total sediment load and streambed elevation data. • Used calibrated and verified HEC-RAS sediment transport model to determine sediment loads, predict riverbed stability, sediment movement and streambed and water surface elevation changes at the end of WY2010. • Defined erosion and deposition zones and sediment source areas. • Flood and sediment transport models delivered to NHDES Dam Bureau for dam removal simulations.
Sediment Terminology • Suspended Sediment Load: That part of the sediment load which is in suspension • Bed Load: Material moving on or near the stream bed by rolling, sliding, and skipping. In strict sense, material finer than about 0.2 mm in diameter is rarely part of the bed load. • Total Sediment Load: Suspended sediment plus bed load • Bed Material: Sediment in the streambed that is at rest, but may re-suspend and move as coarse suspended sediment or as bed load
Data Collection to Determine Sediment Load US DH-95 Suspended Sediment Sampler US BL-84 Bedload Sampler
Suspended and Bedload Sediment Data Collection Locations • Bed material was collected at 30 locations. • Suspended and bed load sediment • data were collected at four locations: • Route 4 in Epsom • Short Falls Road Bridge in Epsom • State Route 28 in Allenstown • U.S. Route 3 in Allenstown Route 4 Short Falls Road Route 28 Route 3
Streambed Characterization: Buck St. Dams to Short Falls Bridge
Average Mean Daily Flow (5/08-10/09) = 570 cfs Bankfull Flow (1.8-Yr) = 3,120 cfs
Average Mean Daily Flow (5/08-10/09) = 600 cfs Bankfull Flow (1.8-Yr) = 3,300 cfs
Sediment Transport Model Results • Sediment discharge per given flow is approximately an order of magnitude greater at Short Falls bridge than at Routes 3 and 28 downstream for the average mean daily discharge, while, for bankfull flow (1.8 Year) sediment discharge is approximately equivalent. • Transported sediment loads decrease dramatically downstream of the Short Falls Road Bridge and remain below the average (of all cross-sections) daily sediment discharge of 165 tons/day. • The reach between the Buck St. Dams and Bear Island is aggrading due to the sediment from the former sand pit area and Leighton Brook.
Suncook River Model Predicted Water Surface Changes from 2008 through the End of WY 2010
Determining Lateral Channel Movement and Depth of Sediment April 18, 2008 May 12, 2007 Line 2 Line 4
Suncook Flood and Sediment Study Products • USGS Scientific Investigations Report (SIR 2010-5127) on the flood mapping study with profile plots of the water surface elevations for the 10-, 50-, 100-, and 500-year floods from the Suncook River confluence with the Merrimack River to the upstream corporate limit for the town of Epsom, NH along with a digital flood map containing the delineation of the 100- and 500-year floodplain : (Available at http://pubs.usgs.gov/sir/2010/5127) • USGS Scientific Investigations Report (SIR) on the sediment transport study with determination of sediment loads and predicted change in streambed elevations and water surface elevations for the 2-, 5-, 10-, 50-, 100-, and 500-year floods from the Suncook River confluence with the Merrimack River to the upstream corporate limit for the town of Epsom, NH : (Available August 2011)
What is Flood Inundation Mapping? • Flood Inundation Mapping (FIM) is a real-time, operational tool that visually relates USGS streamgage readings and NWS forecasts to flood risk for the primary purpose of public safety, but also has significant benefits of: • Understanding changing natural processes that produce hazards • Development of hazard mitigation strategies and technologies • Effectively reduce vulnerability and repetition of loss to infrastructure
Suncook River Flood Inundation Study Objectives • Develop a flood information system for the Suncook River and adjacent floodplain as a pilot project for the northeastern region of the U.S. • Project will provide state and local officials and the public with a means of obtaining detailed information on the extent of actual or forecasted flooding.
Suncook River Flood Inundation Study Scope • Library of flood inundation maps, referenced to the Suncook River streamgage at increments of 7-, 9-, 11-, 12-, 13-, 14-, 15-, 16-, 17-, and 18-feet along with depths will provide detailed information on flooding that is occurring or is forecasted to occur by NWS. • Inundation maps will be available on a USGS public web page with digital map images available to be directly compatible with NWS Northeast River Forecast Center (NRFC) and FEMA’s Flood Risk Management Tool website.
Suncook River Flood Inundation Map • Calibrated extended flow model to flood elevations and flows at the Suncook River streamgage. • Delineation of static flood inundation maps accomplished using a combination of high accuracy/high resolution LiDAR (Light Detection And Ranging) elevation data along with 1- and 4- foot contour interval data (May 2007, April 2008, April 2010). • Maps of flood water depths generated for each of the streamgage referenced flood profiles. • Base maps are a combination of digital ortho-photos collected by Eastern Topographics (2007, 2008) and 1-ft resolution color aerial imagery of southeastern NH (NHDOT, 2006)
FIM: How does it work? • Current Approach • Current flood products focus on: • Real-time USGS streamgage data • NWS forecasts • Difficult for someone to relate a “point” data value to their front step miles away from the streamgage • Have to rely on memory of past events to relate personal risk
FIM: How does it work? New Approach An aerial view of inundated areas directly linked to USGS streamgage and NWS forecast information Static map library starting at NWS action stage and going up to the flood elevation of the 500-yr recurrence interval flood. Related to Minor, Moderate, and Major flood NWS classifications
Who Benefits? • Emergency responders • Position equipment • Evacuate those in harms way • Political Entities • Rapid, early damage estimates • Those in the floodplain • Depth and location of flooding • Access/Egress
Flood Inundation Final Product • Hydraulic model for the 16.5 mile study reach of the Suncook River. • Digital mapping images compatible with the NWS NRFC AHPS (National Weather Service - Northeast River Forecast Center - Advanced Hydrologic Prediction Service) forecast protocols and FEMA’s Flood Risk Management Inundation website. • Public web page displaying current streamflow conditions, flood warnings, potential flood inundation areas and depth maps for the 16.5 mile reach of the Suncook River. • USGS Scientific Investigations Map (SIM) Report describing results of flood inundation mapping.
Next Steps • New Suncook River streamgage to be placed downstream of Route 28 in Allenstown for three years. • Real-time river elevation uploaded to internet to aid emergency responders and residents during flooding. • Relate the FIMs to the new streamgage to test validity of the FIMs.
Questions? For more information concerning these studies contact: rflynn@usgs.gov, hydrologist , NH/VT Water Science Center kwrobins@usgs.gov, director , NH/VT Water Science Center