Download
1 / 6
Common Lizard Species Distribution Analysis
60 likes | 179 Vues
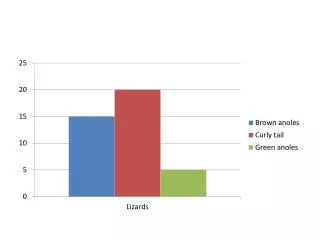
This graph illustrates the distribution of various lizard species, showcasing their relative abundance across different habitats. The y-axis represents the number of individuals observed, while the x-axis categorizes the lizard species. By analyzing the scale of the y-axis and the plotted data points, we can identify which lizard species is most commonly found in the surveyed areas. This analysis provides insight into lizard population dynamics and their habitat preferences, crucial for ecological studies and conservation efforts.
Télécharger la présentation 
Common Lizard Species Distribution Analysis
An Image/Link below is provided (as is) to download presentation
Download Policy: Content on the Website is provided to you AS IS for your information and personal use and may not be sold / licensed / shared on other websites without getting consent from its author.
Content is provided to you AS IS for your information and personal use only.
Download presentation by click this link.
While downloading, if for some reason you are not able to download a presentation, the publisher may have deleted the file from their server.
During download, if you can't get a presentation, the file might be deleted by the publisher.
E N D


More Related