Download
1 / 1
10 likes | 161 Vues
IN53D-1592. Relationship Diagram. Description. Tools. Poster. ToolMatch. Discovering accessibility, display, and manipulation of data in a data portal

E N D
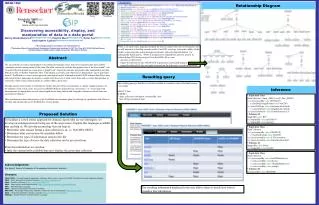
IN53D-1592 Relationship Diagram Description Tools Poster ToolMatch Discovering accessibility, display, and manipulation of data in a data portal Nancy Hoebelheinrich1(nhoebel@kmotifs.com), Patrick West2 (westp@rpi.edu), Peter Fox2(pfox@cs.rpi.edu), Christopher Lynnes3 (christopher.s.lynnes@nasa.gov) (1Knowledge Motifs, San Mateo, CA, United States) (2Tetherless World Constellation, Rensselaer Polytechnic Institute 110 8th St., Troy, NY, 12180 United States) (3Goddard Space Flight Center, NASA, Greenbelt, MD, United States) • SADL is an open source language designed for domain experts who are not ontologists, but are still interested in building formal models of an OWL ontology, testing the validity of the models, expressing rules using ontological concepts, and retrieving information via ontologically based queries. SADL is designed to be English-like, and was used in an Eclipse-Indigo IDE for this project. From the SADL file we can: • generate an rdf/xml file • import the rdf/xml file into CMAP/COE to generate a relationship diagram • import the rdf/xml file into our triple store and run the inferences over the information. Abstract The accessibility of science data products is becoming increasingly easier, with more and more data and scientific community portals coming online all the time. But what can one do with the data product once it has been found? Can I visualize the data product as a map, plot, or graph? Can I import the data into a particular data manipulation tool like MatLab or IDL or iPython Notebook? How is the dataset accessible, and what kind of data products can be generated from it? ToolMatch is a crowd source approach (ontological model, information model, RDF Schema) that allows data and tool providers, and portal developers to enable user discovery of what can be done with a science data product, or conversely, which science data products are usable within a given tool. Example queries may include "I need data for Carbon dioxide (CO2) concentrations, a climate change indicator, for the summer of 2012, that can be accessed via OPeNDAP Hyrax and plotted as a timeseries.", or "I need data with measurements of atmospheric aerosol optical depth sliced along latitude and longitude, returned as netcdf data, and accessible in MatLab." This contribution outlines the progress of the ToolMatch development, plans for utilizing its capabilities, and efforts to leverage and enhance the use of ToolMatch in various portals. Resulting query The resulting query to find the set of tools available to visualize a data collection becomes very simple SELECT ?tool WHERE { <data_collection> toolmatch:visualizedBy ?tool . ?tool rdf:typetoolmatch:Tool . } Inference * Equivalent Class DataCollection<Aqua_AIRS_Level2_Plus_AMSU> and(isAccessedByvalueOPeNDAP) or(hasDataStorageFormatvalueNetCDF) and (usesGridTypevalueAuxiliaryLatLonGrid) or(usesGridTypevalueRegularLatLonGrid) andusesConventionvalueClimateForecast_CF * Subclass Of mappedByvalue IDV andmappedByvalueMcIDAS-V andmappedByvaluePanoply Proposed Solution • To facilitate a crowd source approach for domain experts who are not ontologists, we develop an ontological model using one of the open source, English-like languages available that can help us. We develop an ontology that can help us: • Determine what storage format a data collection is in, i.e. NetCDF4, HDF4 • Determine what conventions the metadata follow • Determine the types of information stored in the file • Determine the type of server the data collection can be accessed from • From this information we can then: • Infer the various tools available that can visualize the given data collection * Equivalent Class DataCollection and (isAccessedByvalue OPeNDAP) or(hasDataFormatvalue NetCDF) and usesConventionvalueCF1Convention and usesConventionvalue RegularLatLonGrid * Subclass Of mappedByvalue Ferret and mappedByvalue GrADS * Equivalent Class DataCollection and (isAccessedByvalue GrADSDataServer) or(isAccessedByvalue Hyrax) or (isAccessedByvalue ThreddsDataServer) or (isAccessedByvalue erddap) * Subclass Of isAccessedByvalue OPeNDAP Acknowledgments: Eric Rozell, Master’s Graduate of Rensselaer Polytechnic institute Glossary: CMAP/COE – Concept Mapping Application Ontology Editor, built on top of the IHMC CmapTools concept mapping software ESIP – Earth Science Information Partners (http://www.esipfed.org/) FOAF - Friend of a Friend (http://xmlns.com/foaf/0.1/) O&M – Observations and Measurements (http://www.opengeospatial.org/standards/om) OWL – Web Ontology Language RDFs – Resource Description Framework Schema RPI/TWC – Rensselaer Polytechnic Institute / Tetherless World Constellation (http://tw.rpi.edu) SADL – Semantic Application Design Language (http://sadl.sourceforge.net/) SPARQL – Simple Protocol and RDF Query Language The resulting information displayed to the user allows them to decide how best to visualize this information