Determinants of Capital Investment in the Economy
590 likes | 611 Vues
This chapter explores the factors that determine the quantity of capital employed in the economy, including the interplay between saving and investment decisions. It also discusses the relationship between physical and financial capital and their role in economic growth.

Determinants of Capital Investment in the Economy
E N D
Presentation Transcript
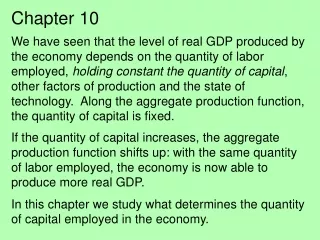
Chapter 10 We have seen that the level of real GDP produced by the economy depends on the quantity of labor employed, holding constant the quantity of capital, other factors of production and the state of technology. Along the aggregate production function, the quantity of capital is fixed. If the quantity of capital increases, the aggregate production function shifts up: with the same quantity of labor employed, the economy is now able to produce more real GDP. In this chapter we study what determines the quantity of capital employed in the economy.
Physical capital is the equipment, buildings, machinery, and other durable goods that have already been produced in the past and are used today to produce goods and services. Financial capital is the funds that firms use to purchase physical capital. The quantity of physical capital therefore depends on the quantity of financial capital.
Growth of physical capital enables the economy to produce more real GDP over time. Thus, growth of the physical capital stock (together with human capital and technology) is the main engine of economic growth. But growth of physical capital requires growth of financial capital to enable firms to purchase more physical capital. The total quantity of financial capital is determined by the interplay between saving and investment decisions in financial markets.
Recall that investment is expenditure by firms on capital goods. Investment expenditures can be on either new capital goods or on additions to inventory. Investment expenditures on new capital goods can be either: Replacement of worn out capital goods, which is called depreciation or Net additions to the stock of capital, which is called net investment. The total amount spent on new capital goods is called gross investment.
Thus, Gross investment = Net investment + Depreciation. Therefore, Net investment, which is the change in the stock of capital = Gross investment – Depreciation.
Numerical example: A firm’s equipment at the beginning of the year is valued at $10,000. During the year, the market value of this equipment falls by $6,000 (depreciation = $6,000), so that the firm’s existing equipment is worth only $4,000. During the year, the firm spends $8,000 on new equipment (gross investment = $8,000). At the end of the year the firm’s capital is worth $4,000 + $8,000 = $12,000. The value of the firm’s capital has increased from $10,000 at the beginning of the year to $12,000 at the end. Therefore, net investment, defined as the change in the firm’s capital stock, is $2,000. Alternatively: Net investment = Gross investment – Depreciation = $8,000 – $6,000 = $2,000.
Investment is financed out of saving – either the firm’s own savings, or by borrowing from other people’s savings. Recall that saving is that portion of income that is not spent on consumption or paid in taxes. Saving means forgoing present consumption in order to attain a higher level of consumption in the future. Wealth is the value of all of the assets that an individual owns. Saving adds to wealth. Wealth also increases when the value of assets rises, which is called capital gains. Thus, Wealth = Saving + Net capital gains
In financial markets, or loanable funds markets, borrowers sell bonds or stocks in order to raise funding to finance investment expenditures. Lenders, or savers, buy bonds or stocks, i.e., they make some of their income available to others to spend, and receive interest or dividends as a reward for doing so. A bond is a claim on future income or consumption, i.e., a promise to pay a specified amount of money at a specified date in the future. A stock is an ownership share in a firm that entitles the holder to receive a portion in the firm’s future profits.
Investment demand Investment demand is the amount of funds that all firms in the economy plan to spend on investment. The quantity of funds demanded for investment purposes depends on the real interest rate. Other things remaining the same, the higher the real interest rate, the smaller is the quantity of funds demanded for investment spending; and the lower the real interest rate, the greater is the quantity of funds demanded for investment spending. Firms effectively rank different investment projects in declining order in terms of expected rate of profit or rate of return:
Thus, for this firm, the investment project with the highest expected rate of return yields a 24% profit. The investment project with the next highest expected rate of return yields 22%, etc. Now, the firm compares these expected rates of profit with the real interest rate. The real interest rate is the opportunity cost of the funds used to purchase the capital goods needed for the investment project. The real interest rate is the opportunity cost of funds whether the firm borrows the funds in the financial market, or uses its own funds, which are called retained earnings.
The firm will undertake an investment project only if the expected rate of return on that project is greater than or equal to the real interest rate. If the expected rate of rate of return is less than the real interest rate, the firm will not undertake that investment project, either because the cost of the funds is greater than the profit the firm will obtain from the investment (if the firm is borrowing the funds) or the firm could earn more by lending the funds in the financial market than spending them on the investment project (if the firm is using its own funds).
Suppose that the real interest rate is 12%. The firm will undertake all of the investment projects whose expected rate of profit is greater than or equal to 12%. This means that the firm will undertake the first seven investment projects but not the eighth:
If the real interest rate were now to decrease to 8%, the number of investment projects that are worthwhile for the firm to undertake will increase. With a real interest rate of 8%, the firm will undertake the first nine investment projects, but not the tenth:
This example illustrates that, for an individual firm, the lower the real interest rate, the greater is the number of investment projects that are worthwhile for the firm to undertake. Therefore, the lower the real interest rate, the greater is the quantity of funds demanded for investment purposes. This same inverse relationship between the quantity of funds demanded for investment and the real interest rate holds true, not only for an individual firm, but for all of the firms in the economy. For the whole economy, the relationship between the quantity of funds demanded for investment and the real interest rate, holding everything else constant, is called investment demand:
In this example, if the real interest rate decreases from 5% to 4%, the quantity of funds demanded for investment increases from $6 trillion to $7 trillion. This is a movement down along the investment demand curve. Vice versa, if the real interest rate increases from 4% to 5%, the quantity of funds demanded for investment decreases from $7 trillion to $6 trillion. This is a movement up along the investment demand curve.
Shifts of investment demand When there is a change in the expected rate of profit, investment demand changes, i.e., the investment demand curve shifts. If the expected rate of profit increases, the quantity of funds demanded for investment at any given real interest rate increases; the investment demand curve shifts to the right. If the expected rate of profit decreases, the quantity of funds demanded for investment at any given real interest rate decreases; the investment demand curve shifts to the left.
Factors that influence the expected rate of profit: In a business cycle expansion, income increases, demand for goods and services increases, and therefore firms expect higher profits. Anticipating higher profit rates in the future, firms will want to produce more output in the future, which means they must expand productive capacity. To expand productive capacity, firms must invest in plant and equipment. Therefore investment spending at each and every real interest rate increases; the investment demand curve shifts to the right.
Technological change lowers costs, raises labor productivity, and brings new and profitable products. But to implement these new technologies, firms must first invest in the equipment that uses them. Therefore, technological advances cause an increase in the quantity of funds demanded for investment at any given real interest rate; the investment demand curve shifts to the right. Population growth causes increased demand for goods and services. To respond to this demand, firms must increase output and thus expand their productive capacity, which means investing in additional capital. Again, the quantity of funds demanded for investment at each real interest rate increases and the investment demand curve shifts to the right.
The supply of saving The higher the real interest rate, the greater is the quantity of saving supplied, other things remaining the same. The lower the real interest rate, the smaller is the quantity of saving supplied, other things remaining the same. The real interest rate is the opportunity cost of consumption expenditure. A dollar spent on consumption is a dollar not saved. Therefore the opportunity cost of consumption is the interest earnings that are forgone as a result of consuming some amount of income instead of saving it and earning interest.
The higher the real interest rate, the greater is the amount of interest earnings forgone when income is spent on consumption instead of saved. Therefore the opportunity cost of consumption is high, and individuals will choose to spend less on consumption and supply more saving. Therefore the quantity of saving supplied increases when the real interest rate increases. The lower the real interest rate, the lower is the amount of interest earnings forgone when income is spent on consumption instead of saved. Therefore the opportunity cost of consumption is low, and individuals will choose to spend more on consumption and supply less saving.
Individuals who are in debt will also save more when the real interest rate increases. A higher real interest rate means an increase in the cost of paying off a given amount of debt, therefore debtors are likely to increase their saving to pay off their debt as quickly as possible when interest rates rise. The relationship between the quantity of saving supplied and the real interest rate, holding everything else constant, is called saving supply:
In this example, if the real interest rate increases from 4% to 5%, the quantity of saving supplied increases from $5 trillion to $6 trillion. This is a movement up along the saving supply curve. Vice versa, if the real interest rate decreases from 5% to 4%, the quantity of saving supplied decreases from $6 trillion to $5 trillion. This is a movement down along the saving supply curve.
Shifts of saving supply When any influence on saving other than the real interest rate changes, there is a change in saving supply, i.e., the saving supply curve shifts. The three main factors that influence saving supply are: Disposable income The purchasing power of net assets Expected future disposable income Disposable income is income earned minus net taxes. The greater a household’s disposable income, other things remaining the same, the greater is its saving.
Therefore, an increase in disposable income causes the quantity of saving supplied at each and every real interest rate to increase; the saving supply curve shifts to the right. Net assets are the assets a household owns minus the debts that it owes. The purchasing power of net assets is the amount of goods and services that those assets can buy. The greater the purchasing power of the net assets a household has accumulated, other things remaining the same, the less it will save.
Therefore, an increase in the purchasing power of net assets causes a decrease in the quantity of saving supplied at any given real interest rate; the saving supply curve shifts to the left. The higher a household’s expected future disposable income, other things being equal, the less it will save. Therefore an increase in expected future disposable income causes the quantity of saving supplied at each real interest rate to decrease and the saving supply curve shifts to the left.
Thus, an increase in disposable income, a decrease in the purchasing power of net assets, or a decrease in expected future disposable income will cause an increase in saving supply. The saving supply curve will shift to the right. Vice versa, a decrease in disposable income, an increase in the purchasing power of net assets, or an increase in expected future disposable income will cause a decrease in saving supply. The saving supply curve will shift to the left.
Financial market equilibrium Financial market equilibrium occurs when the quantity of funds supplied by the savers in the economy is exactly equal to the quantity of funds demanded for investment purposes by the firms in the economy. Therefore financial market equilibrium occurs at the intersection of the saving supply curve and the investment demand curve:
When the real interest rate is 6% per year, the quantity of saving supplied is greater than the quantity of funds demanded for investment. There is an excess supply of funds in the market. Competitive market forces will drive the interest rate down toward equilibrium at point E, eliminating the excess supply. When the real interest rate is 4% per year, the quantity of funds demanded for investment is greater than the quantity of saving supplied. There is an excess demand for funds in the market. Competitive market forces will drive the interest rate up toward equilibrium at point E, eliminating the excess demand.
When the real interest rate is 5%, the quantity of funds supplied by the savers is exactly equal to the quantity of funds demanded for investment, i.e., the market clears. Therefore 5% is the market clearing equilibrium real interest rate. Changes in investment and saving Shifts of the investment demand curve or the saving supply curve cause changes in the market clearing equilibrium real interest rate and the equilibrium levels of investment and saving. For example, a decrease in investment demand:
The investment demand curve shifts from ID0 to ID1. At the initial equilibrium real interest rate of 5%, there is now an excess supply of funds. Competitive market forces will drive the real interest rate down to a new market clearing equilibrium at 4%. The new equilibrium level of saving and investment is $5 trillion. As another example, suppose there were a decrease in the supply of saving:
The saving supply curve shifts from SS0 to SS1. At the initial equilibrium real interest rate of 5%, there is now an excess demand for funds. Competitive market forces will drive the real interest rate up to a new market clearing equilibrium at 6%. The new equilibrium level of saving and investment is $5 trillion.
Investment demand and saving supply fluctuate, so that the market clearing equilibrium real interest rate sometimes increases and sometimes decreases. But in the long run, the trend is for both investment demand and saving supply to increase. However, they increase at about the same rate, so that in the long run the equilibrium real interest rate stays more or less constant.
Government budget and government saving The government borrows funds from financial markets and also supplies saving. Therefore the government budget affects market equilibrium interest rates and the equilibrium quantity of saving and investment in the economy. Recall that, according to the expenditure approach, real GDP is measured in terms of total expenditure on final goods and services. Following the expenditure approach, therefore, GDP, Y, is the sum of consumption expenditure, C, investment, I, government purchases, G, and net exports, NX.
Ignoring the foreign sector, i.e., excluding net exports: Y = C + I + G Recall that, according to the income approach, real GDP can also be measured in terms of the total value of income paid to households for the factors of production they supply. Therefore, real GDP equals total income. There are three things that households can do with their income: consume it, save it, or pay it to the government as net taxes (taxes net of transfer payments). Therefore: Y = C + S + NT
Thus, we have: Y = C + I + G and Y = C + S + NT. Therefore, C + I + G = C + S + NT. Because C appears on both sides of this equation, we can subtract C from both sides and simplify the equation to: I + G = S + NT. Now subtract G from both sides of this equation to obtain: I = S + (NT – G).
This equation tells us that investment is financed either by private saving, S, or by government saving, NT – G. If NT – G > 0, the government is collecting more tax revenue than it is spending: the government has a budget surplus. If NT – G < 0, the government is spending more than it is collecting in tax revenue: the government has a budget deficit.
A government budget surplus If the government has a budget surplus, this means that government saving is positive and therefore adds to private saving. Assume that the government has a budget surplus of $2 trillion, i.e., government saving is $2 trillion. The total supply of saving increases by $2 trillion:
Government saving is a constant $2 trillion at each real interest rate, therefore the total saving supply curve, SS, lies $2 trillion to the right of the private saving supply curve, PS. The horizontal distance between the PS and SS curves is $2 trillion. The market clearing equilibrium real interest rate decreases from 5% to 4%. The equilibrium level of saving and investment increases from $6 trillion to $7 trillion.
Note that the equilibrium level of saving and investment increases by less than the amount of government saving, i.e., BE1 < AE1. This is because the market clearing equilibrium real interest rate decreases from 5% to 4%, causing the quantity of private saving supplied to decrease as we move down the PS curve from E0 to A. The decrease in the quantity of private saving supplied, from $6 trillion to $5 trillion, partially offsets the $2 trillion of added government saving, but, on net, the equilibrium quantity of saving and investment still increases by $1 trillion.


